| Micromolecules: definitions & links | Cellular domains: Genome, preoteome & metabolome |
| Metabolic diversity: Scale, dynamics, & phyletics | Phenotyping strategies: proteomics vs metabolomics |
| CMP Platforms: Platforms and workflow overview | CMP Probes: The probe library |
| CMP Substrates: Molecular trapping & detection | CMP Datasets: Data arrays for multichannel imaging |
| CMP Analysis: pattern recognition theory and tools | CMP Exploration: N-space visualization tools |
| CMP Annotation: browsing & annotating data |
Substrates: Molecular Trapping and Sample Array Fabrication
Trapping

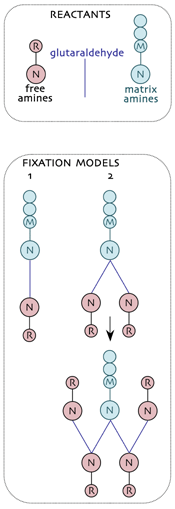
Trapping small molecules for metabolomics visualization involves mimicking the structures formed during hapten production. In general, the bifunctional reagent glutaraldehyde (glutardialdehdye, pentanedial, GA) is an effective tool for trapping free small molecules (R) to the immobile protein matrix (M) via their respective primary amines (N). These are the reactants in tissue capture of small amines.Two models for fixation have emerged and the simplest (model 1: the classical model) is almost certainly wrong as it doesn’t predict the extensive trapping of amines by GA. Under normal fixation conditions, nucleophilic attack of N upon carbonyl C atoms yields a covalent C-N protonated imine which can effect a nucleophilic attack on a second carbonyl, yielding a branch point at each M site (model 2). GA then condenses with free R via their N groups and the process continues as a non-branching dendrimer. Each trapped R regenerates a potential fixation site and in the presence of sufficient GA, high efficiency capture of free R is achieved.
Even this model is likely incomplete because it does not take into account polymerization among GA molecules. Hoewever, it correctly predicts the high efficiency of the R capture by GA in real tissue samples.
Boundary condition models: High GA vs High N
IgGs do not penetrate sections

GA efficiently traps free amines. Quantitative CMP of small molecules is feasible because in situ molecular trapping efficacies are high. GA has a biphasic partition coefficient (approximately 1), rapidly enters cells and traps intracellular free amines R, linking them to the immobile protein matrix, at 65-95% trapping. Intracellular protein levels in mammalian cells are about 0.2 ng/cell, equivalent to 200-500 mM of immobile matrix primary amines (M) to which free amines (R) can be covalently linked. The intracellular repertoire of free organic species is about 60 mM and trapping routinely goes to completion.
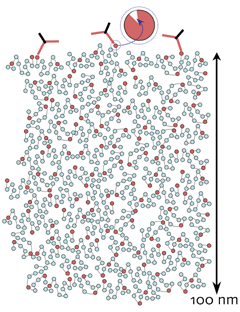
IgGs do not penetrate the GA-M mesh. The fully cross-linked protein matrix, represented roughly to scale in a 100 nm thick section, has a mean pore diameter of 2-5 nm. The standard IgG dimensions of 10 x 7 x 2 nm preclude penetration, and all detection is limited to the surface (Marc et al., 1995, J Neurosci 15: 5106-5129). Thus the detection of R is proportional to the density of epitopes presented on the section surface. More concretely, it is a set of epitopes in an exposed volume. The depth of exposure is likely no more than 1 nm
M = moles/L, S = mean epitope spacing in nm, D = surface density in epitopes/um2: S = 1.186M-1/3 and D=(S/1000)-2
Data from EM immunogold analysis indicates that the efficiency of epitope detection is only about 4%. This can be explained by viewing an epitope as a target on a sphere of 4pi steradians. An efficiency of 4% corresponds to an allowed mobility of about 0.5 steradians or a planar angle of about 40 deg. This is consistent with the general impermeability of the matrix and indicates that only properly oriented epitopes on the surface are detected. Depth of IgG penetration from the surface minimally influences epitope density. For any penetration depth Z in nm, corrected spacings Sc and densities Dc account for the projection onto an image surface: Sc = S x sin(arcos(Z/S)). However, for the Z of fully cross-linked surfaces, the correction is small (1.04 x S for 30 mM).
Surface Epitope Patterning

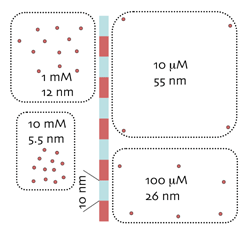
Concentration scales as epitope density. As the etched protein matrix approximates a thin surface, intracellular concentrations of micromolecular targets can be mapped as surface densities. At left are surface patches of epitopes corresponding to 10 mM, 1 mM, 100 uM and 10 uM. Concentrations corresponding to low prevalence molecules are spaced so far apart that they cannot easily be detected with surface methods; e.g. 100 nM species are spaced 0.255 microns apart on average. The detection of macromolecules on surfaces is more difficult than in “soft” specimens using extensive IgG penetration (e.g. confocal or multiphoton imaging). The latter depend on extensive superposition of signals to reach detection thresholds. The difficulties with such strategies for micromolecules are (1) “soft” fixations that do not cross-link lead to massive micromolecule losses and (2) depth-of-field calibrations are needed to determine superposition values, and these are unavailable for the vast majority of confocal images.
| Conc | Detected epitopes/um2 |
Spacing nm |
| 30 mM | 2745 | 3.8 |
| 10 mM | 1320 | 5.5 |
| 3 mM | 592 | 8.2 |
| 1 mM | 284 | 11.9 |
| 300 uM | 127 | 17.7 |
| 100 uM | 61 | 25.5 |
| 30 uM | 27 | 38.2 |
| 10 uM | 13 | 55.0 |
| 3 uM | 5.9 | 82.2 |
| 1 uM | 2.8 | 119 |
| 300 nm | 1.3 | 177 |
| 100 nm | .61 | 256 |
| 30 nm | .27 | 381 |
| 10 nm | .13 | 550 |
| 3 nm | .06 | 822 |
| 1 nm | .03 | 1186 |
Calibrating surface detection.Given a detection efficiency of 4% using immunogold, it is possible to calculate the detected epitope density (which should scale directly with immunofluorescence emission flux) or the optical density produced by silver intensification using a given final size of silver grain (40 nm in this example). Different development times, yielding smaller or larger grains, create a sliding scale of detection ranges. Silver detection has a good dynamic range (much better than enzyme-linked methods) and is absolutely archival, allowing extensive image analysis of complex samples without risk. Fluorescence has better dynamic range as it can exploit signal integration, but fading defects even with the best fluors can compromise quantitation and archiving. Perhaps the best solution will prove to be quantum dot imaging, which suffers much less from fading even after intense excitation. Integration to capture very low level signals will require very high signal-to-noise ratios and will degrade spatial resolution somewhat: 10 nM species cannot be resolved with better than 1 micron resolution, and that is smaller than some cellular structures, such as neuronal dendrites.