Content in migration
Baboon eyecup: 120 min 3 Hz sinusoidal white light + 5 mM AGB
This is a 1.48 mm span from a larger section, registered for A.B.E.G.J.Q.t.y + TB. Image 1 maps y.B.E > rgb, image 2 maps G.B.E > rgb and image 3 is the unaltered monochrome image of the AGB signal captured at 182 nm/pixel. Image 4 is enlarged up to nearly full resolution The light-activated AGB signals are extremely strong and include both on- and off- BCs. All cones are labeled as well, apparently through the constitutively open cGMP-cated NS-cation channel in the synaptic terminal. The strong signal in the choroid is due to the accumulation of AGB in the extracellular space. The strong signal in the optic fiber bundles is due to the fact that AGB does diffuse rapidly down them. Images 5 and 6 index the rgb maps to the AGB image, demonstrating the diverse response patterns of all major cell types.
Blue arrows = bipolar cells
Red circles and arrows are GABAergic ACs
Green circles and arrows are Glycinergic ACs
Black ovals and arrows are HCs
Magenta arrows are GCs
Open spaces in the inner retina are mostly Muller Cells. <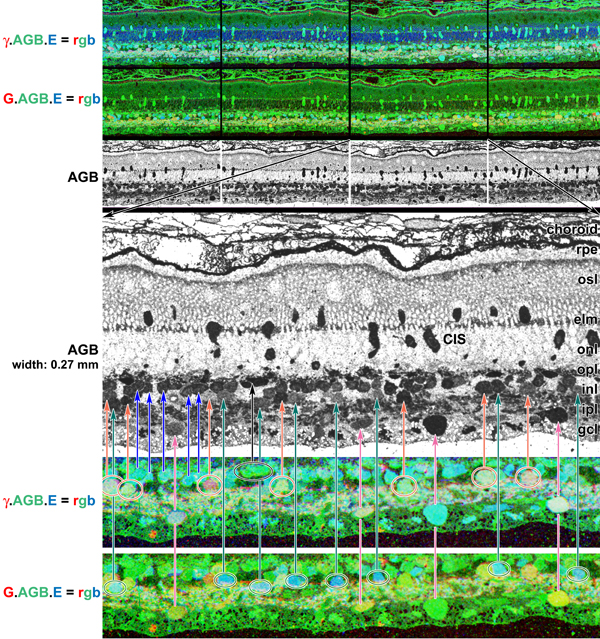
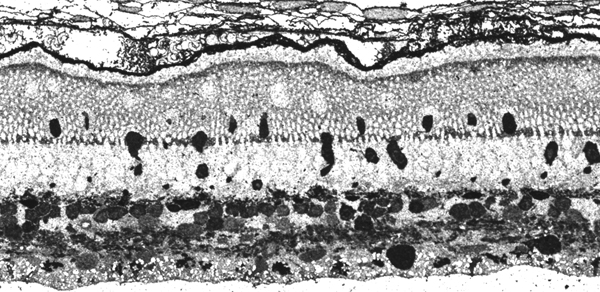
Higher resolution jpg (0.27 mm) of the AGB signal
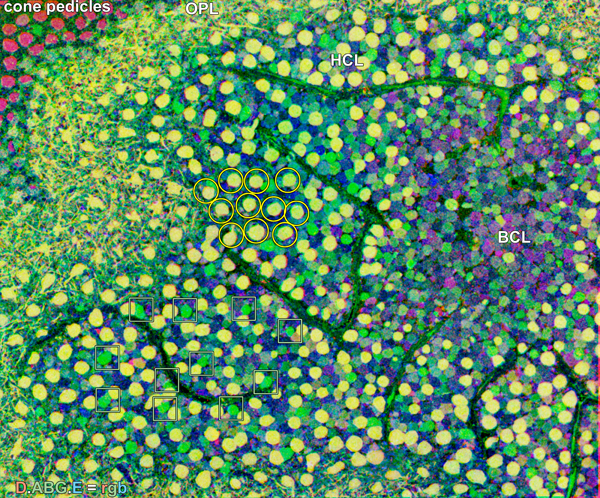 Baboon OPL responses to 25 uM KA
D.B.E = rgb. Bright yellow cells (circles) are the H1 HC cohort, while we believe the sparser bright green cells (squares) to be the H2 HC cohort. The other deeper cells in the BCL are mixed ON and OFF BCs. Note the bright red cone pedicles at the upper left. Image width = 369 um.
0.369 mm wide