SEM vs. TEM is a tradeoff of convenience, resolution, cost and speed. The very physics of SEM signal integration means that the fundamental acquisition time for large canonical volume datasets are incompatible with 5 year grant cycles. SEM based approaches can potentially rival TEM, but dwell time/pixel increases logarithmically with resolution.
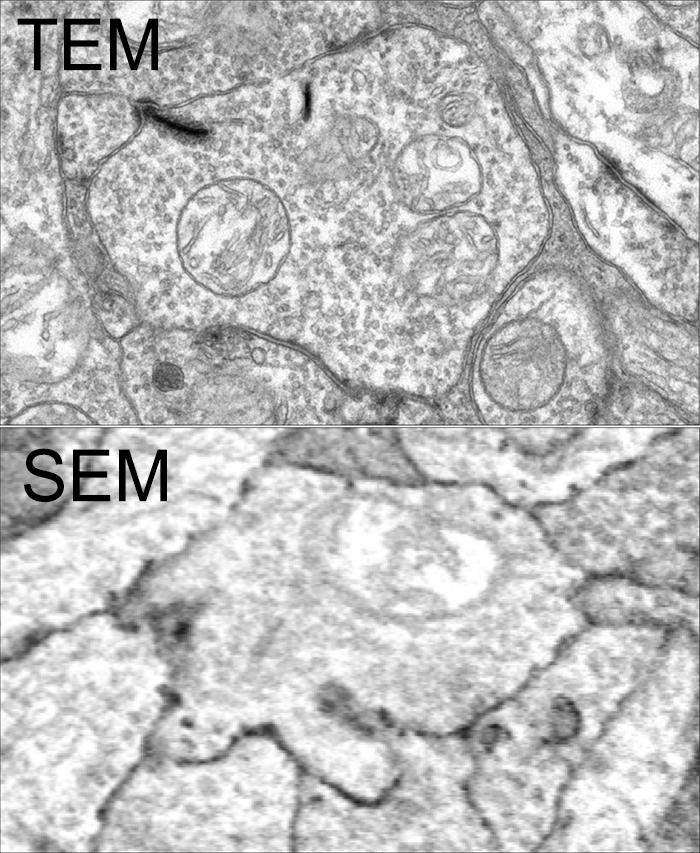
To give you some idea for the resolution differences at routine capture speeds, both of these above images capture a region within the inner plexiform layer of retina, looking at bipolar cell terminals. The TEM image was captured at a standard operating resolution of 2nm/pixel. The SEM image was captured at 16nm/pixel. You cannot see any gap junctions that might be present in the SEM image and you can only infer or guess at synaptic ribbons. And look at the texture!
You *can* get better resolution with SEM, but as I said before, the capture time increases logarithmically. To accomplish what we perform in 8-10 hours with a TEM, would take 108-115 hours on a current, cutting edge multi beam SEM. There are many other advantages of TEM including the ability to capture higher resolution images faster, be able to re-image in goniometric tilt series, be able to integrate molecular markers inside connectome volumes, and a TEM is about 1/3rd the cost of an SEM. Also, SEM images tend to be texturally poor as they are made from capturing electron backscatter of surfaces rather than made by projection of electrons through a small volume, and there is tremendous value in the texture of ultrastructural images. Ergo, this is why we use TEM.
This is not to say that SEM is not a great tool. It is just not the best tool for large scale connectomics where you have to have the resolution to capture all synapses and gap junctions, over large areas. For smaller volumes that do not require a canonical sampling of cell classes, SEM is absolutely an appropriate tool.
This content was originally published on Jonesblog.