Tag Archives: Sieu K. Khuu

Contrast Sensitivity Isocontours Of The Central Visual Field

We have a new manuscript out in Nature Scientific Reports, Contrast Sensitivity Isocontours Of The Central Visual Field.

Authors: Agnes Y. J. Choi, Lisa Nivison-Smith, Jack Phu, Barbara Zangerl, Sieu K. Khuu, Bryan W. Jones, Rebecca L. Pfeiffer, Robert E. Marc & Michael Kalloniatis.

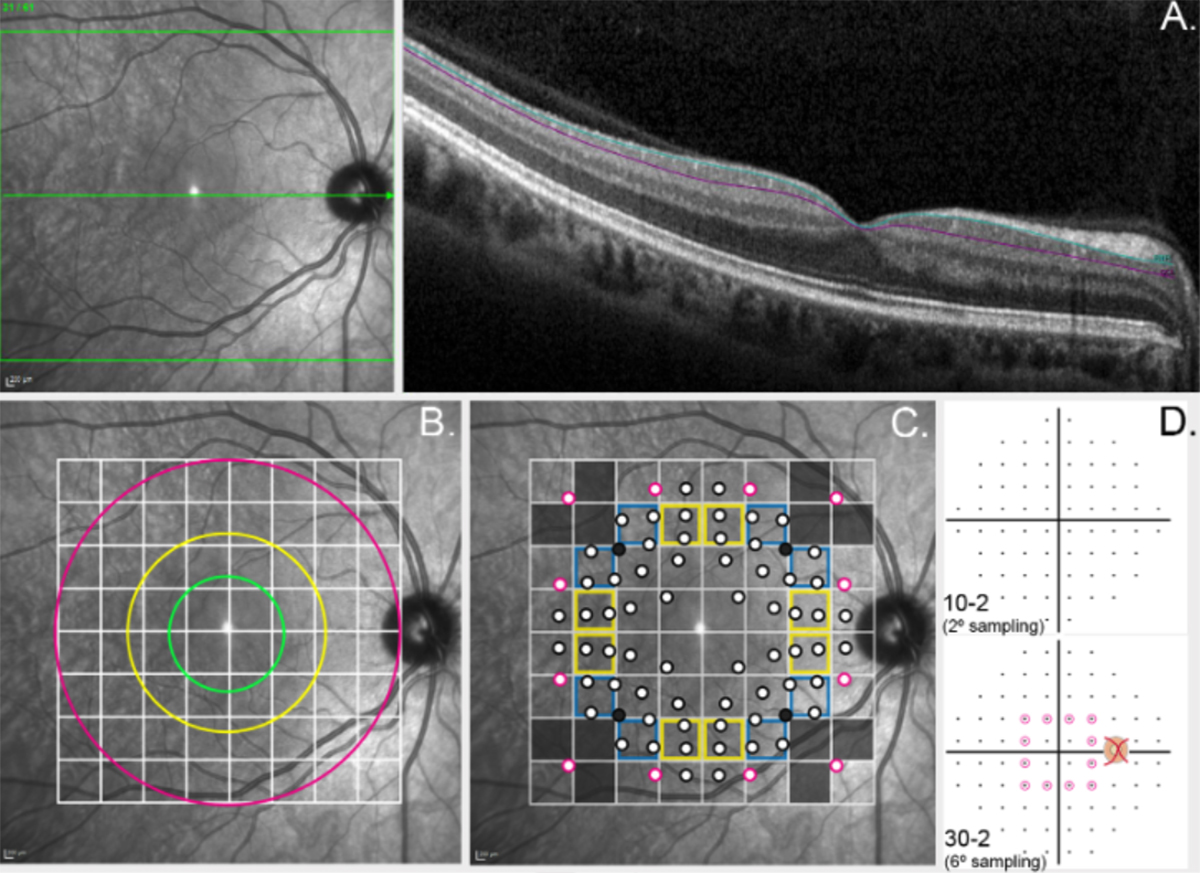
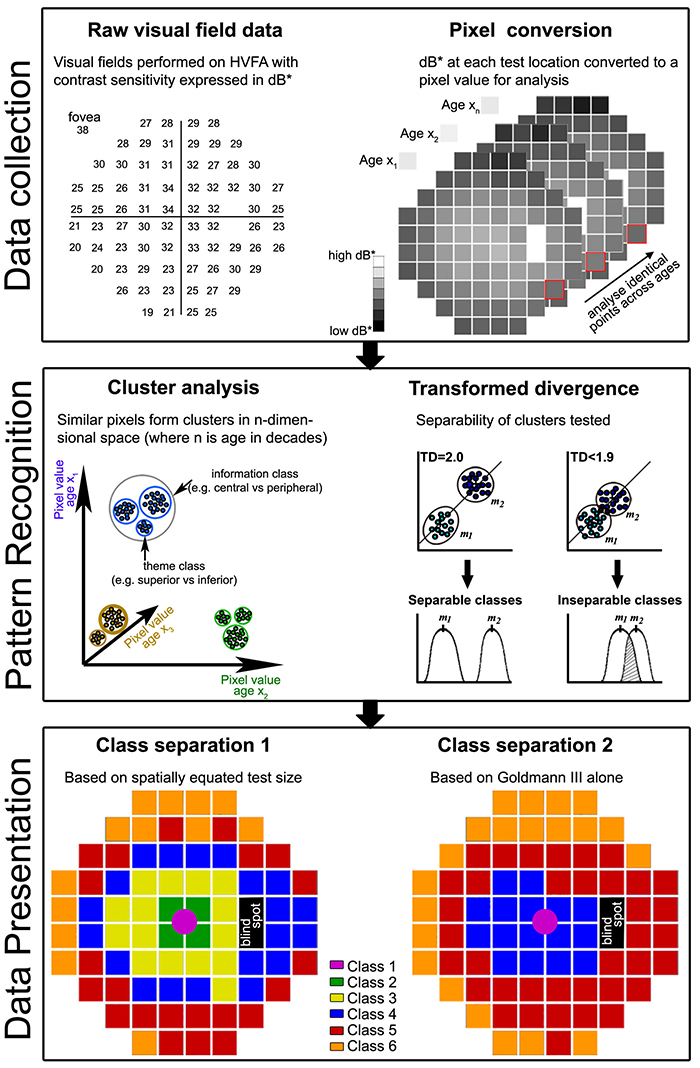
Abstract: Standard automated perimetry (SAP), the most common form of perimetry used in clinical practice, is associated with high test variability, impacting clinical decision making and efficiency. Contrast sensitivity isocontours (CSIs) may reduce test variability in SAP by identifying regions of the visual field with statistically similar patterns of change that can be analysed collectively and allow a point (disease)-to-CSI (normal) comparison in disease assessment as opposed to a point (disease)-to-point (normal) comparison. CSIs in the central visual field however have limited applicability as they have only been described using visual field test patterns with low, 6° spatial sampling. In this study, CSIs were determined within the central 20° visual field using the 10-2 test grid paradigm of the Humphrey Field Analyzer which has a high 2° sampling frequency. The number of CSIs detected in the central 20° visual field was greater than previously reported with low spatial sampling and stimulus size dependent: 6 CSIs for GI, 4 CSIs for GII and GIII, and 3 CSIs for GIV and GV. CSI number and distribution were preserved with age. Use of CSIs to assess visual function in age-related macular degeneration (AMD) found CSI guided analysis detected a significantly greater deviation in sensitivity of AMD eyes from normal compared to a standard clinical pointwise comparison (−1.40 ± 0.15 dB vs −0.96 ± 0.15 dB; p < 0.05). This work suggests detection of CSIs within the central 20° is dependent on sampling strategy and stimulus size and normative distribution limits of CSIs can indicate significant functional deficits in diseases affecting the central visual field such as AMD.

Development Of A Spatial Model Of Age-Related Change In The Macular Ganglion Cell Layer To Predict Function From Structural Changes

We have a new paper out in the Americal Journal of Ophthalmology, Development of a spatial model of age-related change in the macular ganglion cell layer to predict function from structural changes.

Authors: Janelle Tong, Jack Phu, Sieu K. Khuu, Nayuta Yoshioka, Agnes Y. Choi, Lisa Nivison-Smith, Robert E. Marc, Bryan W. Jones, Rebecca L. Pfeiffer, Michael Kalloniatis, and Barbara Zangerl.

Purpose: To develop location specific models of normal, age-related changes in the macular ganglion cell layer (GCL) from optical coherence tomography (OCT). Using these OCT-derived models, we predicted visual field (VF) sensitivity and compared these results to actual VF sensitivities.

Design: Retrospective cohort study

Methods: Single eyes of 254 normal participants were retrospectively enrolled from the Centre for Eye Health (Sydney, Australia). Macular GCL measurements were obtained using Spectralis OCT. Cluster algorithms were performed to identify spatial patterns demonstrating similar age- related change. Quadratic and linear regression models were subsequently utilized to characterize age-related GCL decline. 40 participants underwent additional testing with Humphrey VFs, and 95% prediction intervals were calculated to measure the predictive ability of structure-function models incorporating cluster-based pooling, age-correction and consideration of spatial summation.

Results: Quadratic GCL regression models provided a superior fit (p = <0.0001-0.0066), establishing that GCL decline commences in the late 30’s across the macula. The equivalent linear rates of GCL decline showed eccentricity-dependent variation (0.13μm/year centrally versus 0.06μm/year peripherally), however average, normalized GCL loss per year was consistent across the 64 macular measurement locations at 0.26%. The 95% prediction intervals describing predicted VF sensitivities were significantly narrower across all cluster- based structure-function models (3.79-4.99dB) compared with models without clustering applied (5.66-6.73dB, p <0.0001).

Conclusions: Combining spatial clustering with age-dependent regression allowed the development of robust models describing GCL changes with age. The resultant superior predictive ability of VF sensitivity from ganglion cell measurements may be applied to future models of disease development to improve detection of early macular GCL pathology.

Pattern Recognition Reveals Different Visual Field Signature Patterns When Using Spatially Equated Test Sizes Compared To Standard Goldmann III Alone

This abstract was presented today, May 2th at the 2016 Association for Research in Vision and Opthalmology (ARVO) meetings in Seattle, Washington by Michael Kalloniatis, Robert E. Marc, Sieu K. Khuu, Jack Phu, Barbara Zangerl, Lisa Nivison-Smith, Bryan W. Jones, and Rebecca L. Pfeiffer. 

Abstract Number: 4745

Author Block: Michael Kalloniatis, Robert E. Marc, Sieu K. Khuu, Jack Phu, Barbara Zangerl, Lisa Nivison-Smith, Bryan W. Jones, Rebecca L. Pfeiffer
1 Centre for Eye Health, SOVS, University of New South Wales, Kensington, New South Wales, Australia; 2 SOVS, UNSW, Sydney, New South Wales, Australia; 3 Univ of Utah/Moran Eye Center, Salt Lake City, Utah, United States

Disclosure Block:Michael Kalloniatis, 2014/094035 A1 (USA) and 13865419.9 (EU) (Code P (Patent) ); Robert E. Marc, None; Sieu K. Khuu, 2014/094035 A1 (USA) and 13865419.9 (EU) (Code P (Patent) ); Jack Phu, None; Barbara Zangerl, None; Lisa Nivison-Smith, None; Bryan W. Jones, None; Rebecca L. Pfeiffer, None

Purpose:To identify areas within the visual field with matching contrast sensitivity (CS) signature patterns as a function of age using pattern recognition and determine the discrimination of CS data when using spatially equated test stimuli compared to the single size Goldmann (G)III alone.

Methods:52 subjects (classified in decade age groups from 20-60+ years) were tested using the Humphrey Visual Field Analyser 30-2 paradigm in full threshold mode for GI to GV. At least two thresholds were obtained per size. Two visual field maps were analyzed: a spatially equated visual field where GI was used centrally, GII mid-peripherally and GIII in the outer rings to place the test size at or close to complete spatial summation and a second where a single GIII was used at all locations. Thresholds were expressed as dB* (Khuu & Kalloniatis, IOVS 2015), converted to pixel values and analyzed using an unsupervised classification using isodata clustering (PCI, Geomatica, Canada). Class separation was extracted across the ages to develop dot plots of decade measures of CS.

Results:The 77 data points across the central 60° visual field can be distilled into 6 functional classes using the spatially equated visual field (Class separation 1). The 6 classes reflect areas in visual space that change in a similar manner across the ages. The use of the single GIII target resulted in only 4 classes displaying a poorer discrimination over the central visual field (Class separation 2). Extracted dot plots from class separation illustrated average CS within each class could be assessed across the decades.

Conclusions:When using spatially equated visual field testing, concentric areas were separated into distinct CS signatures consistent with known visual field sensitivity. We confirmed these areas change systematically with age. GIII failed to discriminate central areas of the 30-2 that likely reflects the fact that this size operates outside complete spatial summation and thus may not be the optimal test size for assessing visual function in the central visual field. More importantly, we showed pattern recognition can be applied to complex visual field data sets to identify common features and age-related visual function changes. This analysis allows regions to be averaged as they are statistically identical: this approach will likely assist structure-function studies.