Tag Archives: Miriah Meyer

Mapping the network architecture of gap junctional coupling among parallel processing channels in the mammalian retina

We presented a poster on Mapping the network architecture of gap junctional coupling among parallel processing channels in the mammalian retina at the 2019 HHMI Connectomics meeting in Berlintoday. Downsampled PDF of poster here.

Authors: Crystal L. Sigulinsky, James R. Anderson, Ethan Kerzner, Christopher N. Rapp, Rebecca L. Pfeiffer, Daniel P. Emrich, Kevin D. Rapp, Noah T. Nelson, J. Scott Lauritzen, Miriah Meyer, Robert E. Marc, and Bryan W. Jones.

Abstract: Electrical synapses are fundamental components of neural networks. Gap junctions provide the anatomical basis for electrical synapses and are prevalent throughout the neural retina with essential roles in signal transmission. Gap junctions within and between the parallel processing channels afforded by retinal bipolar cells have been reported or predicted, but their roles, partners, and patterns remain largely unknown. Here, we took advantage of the high resolution of Retinal Connectome 1 (RC1) to reconstruct ON cone bipolar cells (CBCs) and map their coupling topologies.

Graffinity: Visualizing Connectivity in Large Graphs

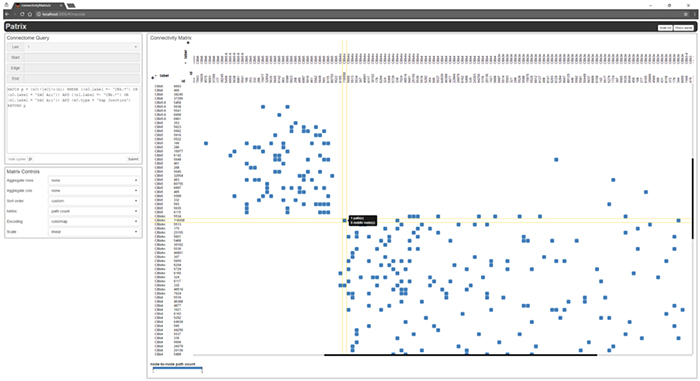
We have a new publication out, (direct link)(Wiley link), Graffinity: Visualizing Connectivity in Large Graphs.  Authors are, Ethan Kerzner (@EthanKerzner), Alexander Lex, Crystal Sigulinsky, Timothy Urness, Bryan W. Jones,  Robert Marc, and Miriah Meyer.

Abstract:  Multivariate graphs are prolific across many fields, including transportation and neuroscience. A key task in graph analysis is the exploration of connectivity, to, for example, analyze how signals flow through neurons, or to explore how well different cities are connected by flights. While standard node-link diagrams are helpful in judging connectivity, they do not scale to large networks. Adjacency matrices also do not scale to large networks and are only suitable to judge connectivity of adjacent nodes. A key approach to realize scalable graph visualization are queries: instead of displaying the whole network, only a relevant subset is shown. Query-based techniques for analyzing connectivity in graphs, however, can also easily suffer from cluttering if the query result is big enough. To remedy this, we introduce techniques that provide an overview of the connectivity and reveal details on demand. We have two main contributions: (1) two novel visualization techniques that work in concert for summarizing graph connectivity; and (2) Graffinity, an open-source implementation of these visualizations supplemented by detail views to enable a complete analysis workflow. Graffinity was designed in a close collaboration with neuroscientists and is optimized for connectomics data analysis, yet the technique is applicable across domains. We validate the connectivity overview and our open-source tool with illustrative examples using flight and connectomics data.