Tag Archives: BWJones

Corticostriatal Circuit Defects in Hoxb8 Mutant Mice

We have a new publication in Molecular Psychiatry, Corticostriatal circuit defects in Hoxb8 mutant mice. (Direct link here).  Authors are:  Naveen Nagarajan, Bryan W. Jones, Peter West, Robert Marc, and Mario R. Capecchi.

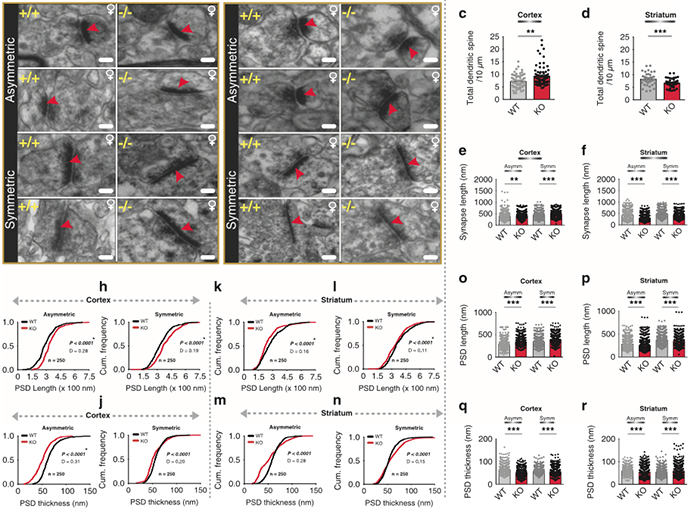
Abstract: Hoxb8 mutant mice exhibit compulsive grooming and hair removal dysfunction similar to humans with the obsessive-compulsive disorder (OCD)-spectrum disorder, trichotillomania. As, in the mouse brain, the only detectable cells that label with Hoxb8 cell lineage appear to be microglia, we suggested that defective microglia cause the neuropsychiatric disorder. Does the Hoxb8 mutation in microglia lead to neural circuit dysfunctions? We demonstrate that Hoxb8 mutants contain corticostriatal circuit defects. Golgi staining, ultra-structural and electrophysiological studies of mutants reveal excess dendritic spines, pre- and postsynaptic structural defects, long-term potentiation and miniature postsynaptic current defects. Hoxb8 mutants also exhibit hyperanxiety and social behavioral deficits similar to mice with neuronal mutations in Sapap3, Slitrk5 and Shank3, reported models of OCD and autism spectrum disorders (ASDs). Long-term treatment of Hoxb8 mutants with fluoxetine, a serotonin reuptake inhibitor, reduces excessive grooming, hyperanxiety and social behavioral impairments. These studies provide linkage between the neuronal defects induced by defective Hoxb8-microglia and neuronal dysfunctions directly generated by mutations in synaptic components that result in mice, which display similar pathological grooming, hyperanxiety and social impairment deficits. Our results shed light on Hoxb8 microglia-driven circuit-specific defects and therapeutic approaches that will become essential to developing novel
therapies for neuropsychiatric diseases such as OCD and ASDs with Hoxb8-microglia being the central target.

Pattern Recognition Analysis Reveals Unique Contrast Sensitivity Isocontours Using Static Perimetry Thresholds Across The Visual Field

We have a new publication in IOVS, Pattern Recognition Analysis Reveals Unique Contrast Sensitivity Isocontours Using Static Perimetry Thresholds Across The Visual Field (Direct link here).  Authors are:  Jack Phu, Sieu Khuu, Lisa Nivison-Smith, Barbara Zangerl, Agnes Yiu, Jeung Choi, Bryan W. JonesRebecca Pfeiffer, Robert Marc, and Michael Kalloniatis.

Purpose
To determine the locus of test locations that exhibit statistically similar age-related decline in sensitivity to light increments and age-corrected contrast sensitivity isocontours (CSIs) across the central visual field (VF). We compared these CSIs with test point clusters used by the Glaucoma Hemifield Test (GHT).

Methods
Sixty healthy observers underwent testing on the Humphrey Field Analyzer 30-2 test grid using Goldmann (G) stimulus sizes I-V. Age-correction factors for GI-V were determined using linear regression analysis. Pattern recognition analysis was used to cluster test locations across the VF exhibiting equal age-related sensitivity decline (age-related CSIs), and points of equal age-corrected sensitivity (age-corrected CSIs) for GI-V.

Results
There was a small but significant test size–dependent sensitivity decline with age, with smaller stimuli declining more rapidly. Age-related decline in sensitivity was more rapid in the periphery. A greater number of unique age-related CSIs was revealed when using smaller stimuli, particularly in the mid-periphery. Cluster analysis of age-corrected sensitivity thresholds revealed unique CSIs for GI-V, with smaller stimuli having a greater number of unique clusters. Zones examined by the GHT consisted of test locations that did not necessarily belong to the same CSI, particularly in the periphery.

Conclusions
Cluster analysis reveals statistically significant groups of test locations within the 30-2 test grid exhibiting the same age-related decline. CSIs facilitate pooling of sensitivities to reduce the variability of individual test locations. These CSIs could guide future structure-function and alternate hemifield asymmetry analyses by comparing matched areas of similar sensitivity signatures.

Pattern Recognition Analysis of Age-Related Retinal Ganglion Cell Signatures In The Human Eye

We have a new publication in IOVS, Pattern Recognition Analysis of Age-Related Retinal Ganglion Cell Signatures In The Human Eye (Direct link here).  Authors are:  Nayuta Yoshioka, Barbara Zangerl, Lisa Nivison-Smith, Sieu Khuu, Bryan W. Jones, Rebecca Pfeiffer, Robert Marc, and Michael Kalloniatis.

Purpose: We recently used pattern recognition analysis to show macula areas can be classified into statistically distinct clusters in accordance to their age-related retinal ganglion cell layer (RGCL) thickness change in a normal population. The aim of this study was to perform a retrospective cross-sectional analysis utilizing a large cohort of patients to establish accuracy of this model and to develop a normative dataset using a 50-year-old equivalent cohort.

Methods: Data was collected from patients seen at the Centre for Eye Health for optic nerve assessment without posterior pole disease. The grid-wise RGCL thickness was obtained from a single eye of each patient via Spectralis OCT macular scan over an 8×8 measurement grid. Measurements for patients outside the 45-54 age range (training cohort) were converted to 50-year-old equivalent value utilizing pattern recognition derived regression model which, in brief, consists of 8×8 grid clustered into 8 distinct classes according to the pattern of RGCL thickness change with age. Accuracy of the predictions was assessed by comparing the training cohort’s measurements to the 45-54 year reference cohort using t-test and one-way ANOVA.

Results: Data were collected from a total 248 patients aged 20 to 78.1 years. 80 patients within this group were aged 45 – 54 and formed the reference cohort (average±SD 49.6±2.83) and the remaining 168 eyes formed the training cohort (average age±SD 50.7±17.34). Converted values for the training set matched those of the reference cohort (average disparity±SD 0.10±0.42µm, range -0.74-1.34µm) and were not significantly different (p > 0.9). Most variability was observed with patients above 70 years of age (average disparity±SD -0.09±1.73µm, range -3.67 to 6.16µm) and central grids corresponding to the fovea (average disparity±SD 0.47±0.72µm, range -0.22 to 1.34µm).

Conclusions: Our regression model for normal age-related RGCL change can accurately convert and/or predict RGCL thickness for individuals in comparison to 50-year-equivalent reference cohort and could allow for more accurate assessment of RGCL thickness and earlier detection of significant loss in the future. Caution may be needed when applying the model in the foveal area or for patients older than 70 years.

Synaptic Inputs To A Gamma Ganglion Cell In Rabbit Retina

This abstract was presented today, May 8th at the 2017 Association for Research in Vision and Opthalmology (ARVO) meetings in Baltimore, Maryland by Andrea Bordt, Diego Perez, Robert E. Marc, James R. Anderson, Carl B. Watt, Bryan W. Jones, Crystal Sigulinsky, James S. Lauritzen, Danny Emrich, Noah Nelson, Luke Tseng, Weiley Liu, and David W. Marshak. Full resolution version here.

Purpose: There are at least 30 distinct types of mammalian retinal ganglion cells, each sensitive to different features of the visual environment, and these can be grouped according to their morphology. One such group, the gamma cells, was identified more than 40 years ago, but their synaptic inputs have never been described. That was the goal of this study.

Methods: The synaptic inputs to a subtype of gamma cell with dendrites ramifying in the outer sublamina of the inner plexiform layer (IPL) of the rabbit retina were identified in a retinal connectome developed using automated transmission electron microscopy.

Results: The gamma cell was always postsynaptic in the IPL, confirming its identity as a ganglion cell. The local synaptic input should produce relatively weak OFF reposnses to stimuli confined to the center of the gamma cell’s receptive field. It typically received only one synapse per bipolar cell from at least 4 types of OFF bipolar cells. Because bipolar cells vary in their response kinetics and contrast sensitivity. each type would provide a small, asynchronous excitatory input. The amacrine cells at the dyad synapses provided only a small amount presynaptic inhibition; reciprocal synapses were observed in only 3 of the 18 ribbon synapses. There was no glycinergic crossover inhibition, another local interaction that would enhance light responses. Local postsynaptic inhibition was somewhat more common; in 6 instances, the bipolar cells presynaptic to the gamma cell or their electrically coupled neighbors also provided input to an amacrine cell that inhibited the gamma cell. The other amacrine cell inputs to the gamma cell should have a much greater impact on the light responses because they are far more numerous. These are from axons and long dendrites of GABAergic amacrine cells, and they provide 60% of all the input. This finding suggests that many types of stimuli in the receptive field surround or outside of the classical receptive field would provide potent inhibition to the gamma cell.

Conclusions: The synaptic inputs rsuggest that gamma cells in rabbit retina would have light responses like their homologs in mouse retina, OFF responses to small stimuli in the receptive field center that are suppressed by a variety of larger stimuli. Thus, they would signal object motion selectively.

Predicting Age-related Changes with High Accuracy using a Pattern Recognition Derived Retinal Ganglion Cell Regression Model

This abstract was presented yesterday, May 7th at the 2017 Association for Research in Vision and Opthalmology (ARVO) meetings in Baltimore, Maryland by Nayuta Yoshioka, Barbara Zangerl, Lisa Nivison-Smith, Sieu Khuu, Bryan W. Jones, Rebecca Pfeiffer, Robert Marc, and Michael Kalloniatis.

Purpose: We recently used pattern recognition analysis to show macula areas can be classified into statistically distinct clusters in accordance to their age-related retinal ganglion cell layer (RGCL) thickness change in a normal population. The aim of this study was to perform a retrospective cross-sectional analysis utilizing a large cohort of patients to establish accuracy of this model and to develop a normative dataset using a 50-year-old equivalent cohort.

Methods: Data was collected from patients seen at the Centre for Eye Health for optic nerve assessment without posterior pole disease. The grid-wise RGCL thickness was obtained from a single eye of each patient via Spectralis OCT macular scan over an 8×8 measurement grid. Measurements for patients outside the 45-54 age range (training cohort) were converted to 50-year-old equivalent value utilizing pattern recognition derived regression model which, in brief, consists of 8×8 grid clustered into 8 distinct classes according to the pattern of RGCL thickness change with age. Accuracy of the predictions was assessed by comparing the training cohort’s measurements to the 45-54 year reference cohort using t-test and one-way ANOVA.

Results: Data were collected from a total 248 patients aged 20 to 78.1 years. 80 patients within this group were aged 45 – 54 and formed the reference cohort (average±SD 49.6±2.83) and the remaining 168 eyes formed the training cohort (average age±SD 50.7±17.34). Converted values for the training set matched those of the reference cohort (average disparity±SD 0.10±0.42µm, range -0.74-1.34µm) and were not significantly different (p > 0.9). Most variability was observed with patients above 70 years of age (average disparity±SD -0.09±1.73µm, range -3.67 to 6.16µm) and central grids corresponding to the fovea (average disparity±SD 0.47±0.72µm, range -0.22 to 1.34µm).

Conclusions: Our regression model for normal age-related RGCL change can accurately convert and/or predict RGCL thickness for individuals in comparison to 50-year-equivalent reference cohort and could allow for more accurate assessment of RGCL thickness and earlier detection of significant loss in the future. Caution may be needed when applying the model in the foveal area or for patients older than 70 years.

Metabolic Impacts of Cigarette Smoke On The Retina of Complement-Compromised Mice

This abstract was presented today, May 8th at the 2017 Association for Research in Vision and Opthalmology (ARVO) meetings in Baltimore, Maryland by Felix Vazquez-Chona, Alex Butler, Emile McKinnon, Baerbel Rohrer, and Bryan W. Jones. Full resolution version here.

Purpose: The interaction between metabolism and the immune system is hypothesized as playing a central role in the pathology of neural diseases including Age-Related Macular Degeneration (AMD). We investigated the effects of cigarette-smoke exposure (CSE) on metabolism of retinal cells in wild-type (wt) mice, and mice deficient for the alternative pathway (complement factor B, CfB) or common terminal pathway (complement component 3, C3).

Methods: Mice were exposed to CSE or room filtered-air (controls) for 6 h/d, 5 d/wk for 6 months. We visualized the metabolism of retinal cells using Computational Molecular Phenotyping (CMP). Retinal cell classification and metabolic adaptation were interrogated using arginine (R), aspartate (D), GABA (γ), glutamate (E), glycine (G), glutathione (J), glutamine (Q), taurine (τ), glutamine synthetase (GS), and cellular retinaldehyde binding protein (CRALBP). Electron microscope mosaics were instrumental in phenotyping metabolic profiles.

Results: CSE C3-/- animals show more severe degenerative indices than CSE WT: retinal pigment epithelium (RPE) exhibited a decreased basalateral infolding area and increased vacuolization; photoreceptors show increased mitochondrial swelling and pyknosis; Müller glia displayed hypertrophy; and the amacrine layer was affected by increased vacuolization. The CfB-/- retina was more resilient to the negative effects of CSE when compared to the WT retina. At the metabolic level, RPE and inner segments of CSE CfB-/- mice displayed modest changes. In contrast, changes in CSE C3-/- and WT retina were dramatic: RPE exhibited decreased CRALBP and elevated R-E-J-τ-γ levels; inner segments showed increased R-D-E-G-J-Q-τ-γ-CRALBP; and Müller glia were found to have decreased levels along the R-D-E-G-J-Q-τ-γ-GS-CRALBP axis.

Conclusions: Increased GABA levels in RPE and photoreceptors are consistent with Müller glia dysfunction. Our metabolic profiling suggests that RPE and Müller glia are vulnerable to CSE-induced oxidative stress. We also find that the potential complement activation status of the retina-RPE-choroid unit highly influences the metabolic response of retinal cells to CSE. As complete blockade of the complement system in the C3-/- model has a more dramatic impact on metabolism of RPE, Müller glia, and photoreceptors than observed in the CfB-/- model, it can be proposed that downstream signaling of the complement system is required for retina health.

Layman Abstract: Metabolism involves a complex circuitry of metabolic pathways, intermediates, and cell-cell interactions. Thus, mapping metabolism with cellular resolution and quantitative power is key to identifying robust biomarkers of disease progression.

Graffinity: Visualizing Connectivity in Large Graphs

We have a new publication out, (direct link)(Wiley link), Graffinity: Visualizing Connectivity in Large Graphs.  Authors are, Ethan Kerzner (@EthanKerzner), Alexander Lex, Crystal Sigulinsky, Timothy Urness, Bryan W. Jones,  Robert Marc, and Miriah Meyer.

Abstract:  Multivariate graphs are prolific across many fields, including transportation and neuroscience. A key task in graph analysis is the exploration of connectivity, to, for example, analyze how signals flow through neurons, or to explore how well different cities are connected by flights. While standard node-link diagrams are helpful in judging connectivity, they do not scale to large networks. Adjacency matrices also do not scale to large networks and are only suitable to judge connectivity of adjacent nodes. A key approach to realize scalable graph visualization are queries: instead of displaying the whole network, only a relevant subset is shown. Query-based techniques for analyzing connectivity in graphs, however, can also easily suffer from cluttering if the query result is big enough. To remedy this, we introduce techniques that provide an overview of the connectivity and reveal details on demand. We have two main contributions: (1) two novel visualization techniques that work in concert for summarizing graph connectivity; and (2) Graffinity, an open-source implementation of these visualizations supplemented by detail views to enable a complete analysis workflow. Graffinity was designed in a close collaboration with neuroscientists and is optimized for connectomics data analysis, yet the technique is applicable across domains. We validate the connectivity overview and our open-source tool with illustrative examples using flight and connectomics data.

The Rod-Cone Crossover Connectome of Mammalian Bipolar Cells

We have a new publication out (direct link), The rod-cone crossover connectome of mammalian bipolar cells authored by Scott Lauritzen, Crystal Sigulinsky, James Anderson, Michael Kalloniatis, Noah Nelson, Danny Emrich, Chris Rapp, Nicolas McCarthy, Ethan Kerzner, Mariah Meyer, Bryan W. Jones, and Robert Marc.

Abstract: The basis of cross-suppression between rod and cone channels has long been an enigma. Using rabbit retinal connectome RC1, we show that all cone bipolar cell (BC) classes inhibit rod BCs via amacrine cell (AC) motifs (C1-6); that all cone BC classes are themselves inhibited by AC motifs (R1-5, R25) driven by rod BCs. A sparse symmetric AC motif (CR) is presynaptic and postsynaptic to both rod and cone BCs. ON cone BCs of all classes drive inhibition of rod BCs via motif C1 wide-field GABAergic ACs (γACs) and motif C2 narrow field glycinergic ON ACs (GACs). Each rod BC receives ≈ 10 crossover AC synapses and each ON cone BC can target ≈ 10 or more rod BCs via separate AC processes. OFF cone BCs mediate monosynaptic inhibition of rod BCs via motif C3 driven by OFF γACs and GACs and disynaptic inhibition via motifs C4 and C5 driven by OFF wide-field γACs and narrow-field GACs, respectively. Motifs C4 and C5 form halos of 60-100 inhibitory synapses on proximal dendrites of AI γACs. Rod BCs inhibit surrounding arrays of cone BCs through AII GAC networks that access ON and OFF cone BC patches via motifs R1, R2, R4 R5 and a unique ON AC motif R3 that collects rod BC inputs and targets ON cone BCs. Crossover synapses for motifs C1, C4, C5 and R3 are 3-4x larger than typical feedback synapses, which may be a signature for synaptic winner-take-all switches.

Retinal Remodeling And Metabolic Alterations in Human AMD

We have a new publication out (direct link, open access), Müller Cell Metabolic Chaos During Retinal Degeneration authored by Bryan W. JonesRebecca Pfeiffer, William Ferrell, Carl Watt, James Tucker, and Robert Marc.

Abstract:

Age-related macular degeneration (AMD) is a progressive retinal degeneration resulting in central visual field loss, ultimately causing debilitating blindness. AMD affects 18% of Americans from 65 to 74, 30% older than 74 years of age and is the leading cause of severe vision loss and blindness in Western populations. While many genetic and environmental risk factors are known for AMD, we currently know less about the mechanisms mediating disease progression. The pathways and mechanisms through which genetic and non-genetic risk factors modulate development of AMD pathogenesis remain largely unexplored. Moreover, current treatment for AMD is palliative and limited to wet/exudative forms. Retina is a complex, heterocellular tissue and most retinal cell classes are impacted or altered in AMD. Defining disease and stage-specific cytoarchitectural and metabolic responses in AMD is critical for highlighting targets for intervention. The goal of this article is to illustrate cell types impacted in AMD and demonstrate the implications of those changes, likely beginning in the retinal pigment epithelium (RPE), for remodeling of the the neural retina. Tracking heterocellular responses in disease progression is best achieved with computational molecular phenotyping (CMP), a tool that enables acquisition of a small molecule fingerprint for every cell in the retina. CMP uncovered critical cellular and molecular pathologies (remodeling and reprogramming) in progressive retinal degenerations such as retinitis pigmentosa (RP). We now applied these approaches to normal human and AMD tissues mapping progression of cellular and molecular changes in AMD retinas, including late-stage forms of the disease.

Müller Cell Metabolic Chaos During Retinal Degeneration

We have a new publication out (direct link, open access), Müller Cell Metabolic Chaos During Retinal Degeneration authored by Rebecca PfeifferRobert Marc, Mineo Kondo, Hiroko Terasaki and Bryan W. Jones.

Abstract:

Müller cells play a critical role in retinal metabolism and are among the first cells to demonstrate metabolic changes in retinal stress or disease. The timing, extent, regulation, and impacts of these changes are not yet known. We evaluated metabolic phenotypes of Müller cells in the degenerating retina.

Retinas harvested from wild-type (WT) and rhodopsin Tg P347L rabbits were fixed in mixed aldehydes and resin embedded for computational molecular phenotyping (CMP). CMP facilitates small molecule fingerprinting of every cell in the retina, allowing evaluation of metabolite levels in single cells.

CMP revealed signature variations in metabolite levels across Müller cells from TgP347L retina. In brief, neighboring Müller cells demonstrated variability in taurine, glutamate, glutamine, glutathione, glutamine synthetase (GS), and CRALBP. This variability showed no correlation across metabolites, implying the changes are functionally chaotic rather than simply heterogeneous. The inability of any clustering algorithm to classify Müller cell as a single class in the TgP347L retina is a formal proof of metabolic variability in the present in degenerating retina.

Although retinal degeneration is certainly the trigger, Müller cell metabolic alterations are not a coherent response to the microenvironment. And while GS is believed to be the primary enzyme responsible for the conversion of glutamate to glutamine in the retina, alternative pathways appear to be unmasked in degenerating retina. Somehow, long term remodeling involves loss of Müller cell coordination and identity, which has negative implications for therapeutic interventions that target neurons alone.