Tag Archives: Sieu Khuu

Pattern Recognition Analysis Reveals Unique Contrast Sensitivity Isocontours Using Static Perimetry Thresholds Across The Visual Field

We have a new publication in IOVS, Pattern Recognition Analysis Reveals Unique Contrast Sensitivity Isocontours Using Static Perimetry Thresholds Across The Visual Field (Direct link here).  Authors are:  Jack Phu, Sieu Khuu, Lisa Nivison-Smith, Barbara Zangerl, Agnes Yiu, Jeung Choi, Bryan W. JonesRebecca Pfeiffer, Robert Marc, and Michael Kalloniatis.

Purpose
To determine the locus of test locations that exhibit statistically similar age-related decline in sensitivity to light increments and age-corrected contrast sensitivity isocontours (CSIs) across the central visual field (VF). We compared these CSIs with test point clusters used by the Glaucoma Hemifield Test (GHT).

Methods
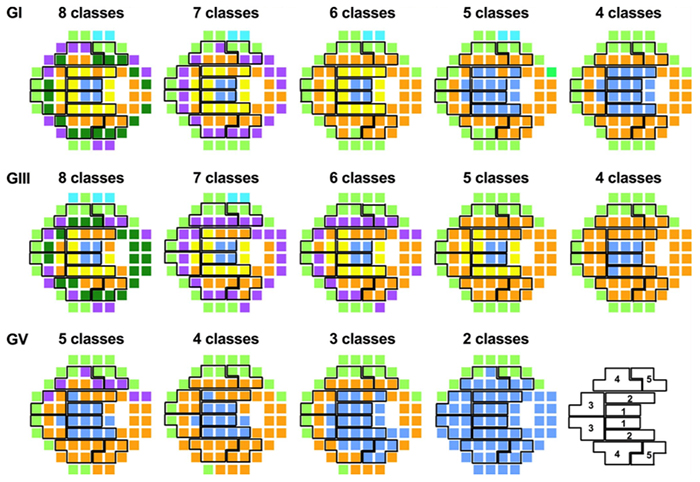
Sixty healthy observers underwent testing on the Humphrey Field Analyzer 30-2 test grid using Goldmann (G) stimulus sizes I-V. Age-correction factors for GI-V were determined using linear regression analysis. Pattern recognition analysis was used to cluster test locations across the VF exhibiting equal age-related sensitivity decline (age-related CSIs), and points of equal age-corrected sensitivity (age-corrected CSIs) for GI-V.

Results
There was a small but significant test size–dependent sensitivity decline with age, with smaller stimuli declining more rapidly. Age-related decline in sensitivity was more rapid in the periphery. A greater number of unique age-related CSIs was revealed when using smaller stimuli, particularly in the mid-periphery. Cluster analysis of age-corrected sensitivity thresholds revealed unique CSIs for GI-V, with smaller stimuli having a greater number of unique clusters. Zones examined by the GHT consisted of test locations that did not necessarily belong to the same CSI, particularly in the periphery.

Conclusions
Cluster analysis reveals statistically significant groups of test locations within the 30-2 test grid exhibiting the same age-related decline. CSIs facilitate pooling of sensitivities to reduce the variability of individual test locations. These CSIs could guide future structure-function and alternate hemifield asymmetry analyses by comparing matched areas of similar sensitivity signatures.

Pattern Recognition Analysis of Age-Related Retinal Ganglion Cell Signatures In The Human Eye

We have a new publication in IOVS, Pattern Recognition Analysis of Age-Related Retinal Ganglion Cell Signatures In The Human Eye (Direct link here).  Authors are:  Nayuta Yoshioka, Barbara Zangerl, Lisa Nivison-Smith, Sieu Khuu, Bryan W. Jones, Rebecca Pfeiffer, Robert Marc, and Michael Kalloniatis.

Purpose: We recently used pattern recognition analysis to show macula areas can be classified into statistically distinct clusters in accordance to their age-related retinal ganglion cell layer (RGCL) thickness change in a normal population. The aim of this study was to perform a retrospective cross-sectional analysis utilizing a large cohort of patients to establish accuracy of this model and to develop a normative dataset using a 50-year-old equivalent cohort.

Methods: Data was collected from patients seen at the Centre for Eye Health for optic nerve assessment without posterior pole disease. The grid-wise RGCL thickness was obtained from a single eye of each patient via Spectralis OCT macular scan over an 8×8 measurement grid. Measurements for patients outside the 45-54 age range (training cohort) were converted to 50-year-old equivalent value utilizing pattern recognition derived regression model which, in brief, consists of 8×8 grid clustered into 8 distinct classes according to the pattern of RGCL thickness change with age. Accuracy of the predictions was assessed by comparing the training cohort’s measurements to the 45-54 year reference cohort using t-test and one-way ANOVA.

Results: Data were collected from a total 248 patients aged 20 to 78.1 years. 80 patients within this group were aged 45 – 54 and formed the reference cohort (average±SD 49.6±2.83) and the remaining 168 eyes formed the training cohort (average age±SD 50.7±17.34). Converted values for the training set matched those of the reference cohort (average disparity±SD 0.10±0.42µm, range -0.74-1.34µm) and were not significantly different (p > 0.9). Most variability was observed with patients above 70 years of age (average disparity±SD -0.09±1.73µm, range -3.67 to 6.16µm) and central grids corresponding to the fovea (average disparity±SD 0.47±0.72µm, range -0.22 to 1.34µm).

Conclusions: Our regression model for normal age-related RGCL change can accurately convert and/or predict RGCL thickness for individuals in comparison to 50-year-equivalent reference cohort and could allow for more accurate assessment of RGCL thickness and earlier detection of significant loss in the future. Caution may be needed when applying the model in the foveal area or for patients older than 70 years.

Predicting Age-related Changes with High Accuracy using a Pattern Recognition Derived Retinal Ganglion Cell Regression Model

This abstract was presented yesterday, May 7th at the 2017 Association for Research in Vision and Opthalmology (ARVO) meetings in Baltimore, Maryland by Nayuta Yoshioka, Barbara Zangerl, Lisa Nivison-Smith, Sieu Khuu, Bryan W. Jones, Rebecca Pfeiffer, Robert Marc, and Michael Kalloniatis.

Purpose: We recently used pattern recognition analysis to show macula areas can be classified into statistically distinct clusters in accordance to their age-related retinal ganglion cell layer (RGCL) thickness change in a normal population. The aim of this study was to perform a retrospective cross-sectional analysis utilizing a large cohort of patients to establish accuracy of this model and to develop a normative dataset using a 50-year-old equivalent cohort.

Methods: Data was collected from patients seen at the Centre for Eye Health for optic nerve assessment without posterior pole disease. The grid-wise RGCL thickness was obtained from a single eye of each patient via Spectralis OCT macular scan over an 8×8 measurement grid. Measurements for patients outside the 45-54 age range (training cohort) were converted to 50-year-old equivalent value utilizing pattern recognition derived regression model which, in brief, consists of 8×8 grid clustered into 8 distinct classes according to the pattern of RGCL thickness change with age. Accuracy of the predictions was assessed by comparing the training cohort’s measurements to the 45-54 year reference cohort using t-test and one-way ANOVA.

Results: Data were collected from a total 248 patients aged 20 to 78.1 years. 80 patients within this group were aged 45 – 54 and formed the reference cohort (average±SD 49.6±2.83) and the remaining 168 eyes formed the training cohort (average age±SD 50.7±17.34). Converted values for the training set matched those of the reference cohort (average disparity±SD 0.10±0.42µm, range -0.74-1.34µm) and were not significantly different (p > 0.9). Most variability was observed with patients above 70 years of age (average disparity±SD -0.09±1.73µm, range -3.67 to 6.16µm) and central grids corresponding to the fovea (average disparity±SD 0.47±0.72µm, range -0.22 to 1.34µm).

Conclusions: Our regression model for normal age-related RGCL change can accurately convert and/or predict RGCL thickness for individuals in comparison to 50-year-equivalent reference cohort and could allow for more accurate assessment of RGCL thickness and earlier detection of significant loss in the future. Caution may be needed when applying the model in the foveal area or for patients older than 70 years.