Increasing Electrical Stimulation Efficacy in Degenerated Retina: Stimulus Waveform Design in a Multiscale Computational Model

We have a new publication out (direct link), Increasing Electrical Stimulation Efficacy in Degenerated Retina: Stimulus Waveform Design in a Multiscale Computational Model authored by Kyle Loizos, Robert Marc, Mark Humayun, James R. Anderson, Bryan W. Jones and Gianluca Lazzi.

Abstract—A computational model of electrical stimulation of the retina is proposed for investigating current waveforms used in prosthetic devices for restoring partial vision lost to retina degen- erative diseases. The model framework combines a connectome- based neural network model characterized by accurate mor- phological and synaptic properties with an Admittance Method model of bulk tissue and prosthetic electronics. In this model, the retina was computationally “degenerated,” considering cellular death and anatomical changes that occur early in disease, as well as altered neural behavior that develops throughout the neurodegeneration and is likely interfering with current attempts at restoring vision. A resulting analysis of stimulation range and threshold of ON ganglion cells within retina that are either healthy or in beginning stages of degeneration is presented for currently-used stimulation waveforms, and an asymmetric biphasic current stimulation for subduing spontaneous firing to allow increased control over ganglion cell firing patterns in degenerated retina is proposed. Results show that stimulation thresholds of retinal ganglion cells do not notably vary after beginning stages of retina degeneration. In addition, simulation of proposed asymmetric waveforms showed the ability to enhance the control of ganglion cell firing via electrical stimulation.
Structure-Function Correlation Across The Central Visual Field Using Pointwise Comparisons and Ganglion Cell Isocontours Derived From Pattern Recognition

We presented an abstract for 23rd International visual field and imaging symposium in Kanazawa, Japan on May 12th titled, Structure-function correlation across the central visual field using pointwise comparisons and ganglion cell isocontours derived from pattern recognition.  Authors are:

Kalloniatis M1,2, Tong J1,2, Yoshioka N1,2, Khuu SK2, Phu J1,2, Choi A1,2, Zangerl B1, Nivison-Smith L1,2, Bui BV4, Marc RE3, Jones BW3

  1. Centre for Eye Health, University of New South Wales (UNSW), Kensington, NSW, Australia.
  2. School of Optometry and Vision Science, UNSW, Sydney, NSW, Australia.
  3. Moran Eye Center, Univ of Utah, Salt Lake City, UT, United States of America.
  4. Department of Optometry and Vision Science, Univ of Melbourne, Parkville, Victoria, Australia

Purpose: To establish the correlation between visual field sensitivity and ganglion cell density within the central 20 degrees.  We hypothesized that the use of a test stimulus within complete spatial summation (Goldmann II, GII) would display improved correlation compared to the standard GIII test stimulus.

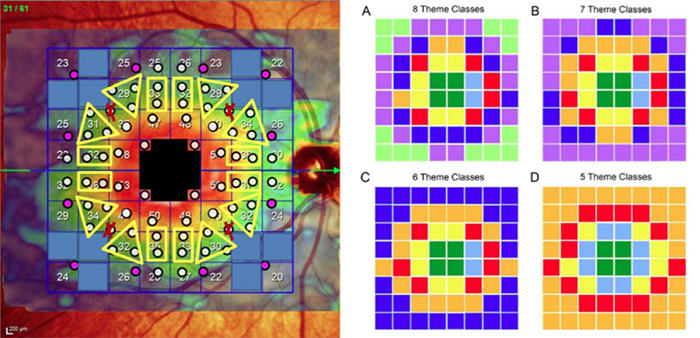
Methods:One eye of 40 normal subjectswas included in this study. The Humphrey Field Analyser (HFA) was used in full-threshold mode for the 10-2 test grid and 12 points from the 30-2 grid that matched the outer Spectralis grid. Spectralis OCT posterior pole scans for each subject was extracted and the average ganglion cell layer (GCL) thickness values were obtained for each of the 64 grid location within the measurement area ~6880µmx6880µm.  HFA sensitivity in dB was plotted against GC density/mm3(calculated from GCL thickness and GC density from histological data, also converted into dB). Both visual field and OCT data were converted to a 50 year-old equivalent for analysis. The Drasdo et al VR 2007 correction was applied to visual field data to allow comparison of structure and function (Fig. 1). Linear regression analysis was conducted at each test location using individual data or grouped data derived using the 5, 6, 7 and 8 GC iso-density theme classes of Yoshioka et al IOVS 2017 (Fig. 1). A non-parametric bootstrap was used to determine the 99% distribution limits of the slope and correlation parameters.

Results: Table 1 shows the structure-function correlation slope parameters and coefficients of determination (R2) for point-wise and theme class-based comparisons, using GII and GIII. The use of 5 or 6 theme classes resulted in a slope close to unity and high R2values for GII. Table 2 shows the 99% distribution of the slope parameters and R2values for point wise comparisons and those using 5 theme classes again demonstrating superior correlations for GII (both slope and R2 significantly different p<0.01 compared to pointwise analysis). Correcting the data for test size difference (6dB) did not result in data superposition confirming that GIII test size is not within complete spatial summation within the central 20 degrees.

Conclusions:Using a test stimulus within complete spatial summation (GII) and grouping sensitivities according to GC density test grids derived using pattern recognition (7 or fewer GC theme classes), revealed correlations close to unity with coefficients of determination (R2) >0.90. The high correlations achieved when using theme classes even when using individual datasets, suggests that an approach would provide a useful method to predict alterations of visual field sensitivity from OCT data.

Commercial Relationships Disclosure:MK and SKK commercial Relationship(s):2014/094035 A1 (USA) and 13865419.9 (EU):Code P (Patent): REM, JT, BZ, L N-S, BJ, RF: none

Grant support:  NHMRC 1033224;Guide Dogs NSW/ACT; NIH EY02576, EY015128, EY014800, an Unrestricted Grant to the Moran Eye Center from Research to Prevent Blindness.

A Pathoconnectome of Early Retinal Remodeling

This abstract was presented today, Monday, April 30th at the 2018 Association for Research in Vision and Opthalmology (ARVO) meetings in Honolulu, Hawaii by Rebecca Pfeiffer, Robert E. Marc, James R. Anderson, Daniel P. Emrich, Carl B. Watt, Jia-Hui Yang, Kevin D. Rapp, Jeebika Dahal, Mineo Kondo, Hiroko Terasaki, and Bryan W. Jones.

Purpose:
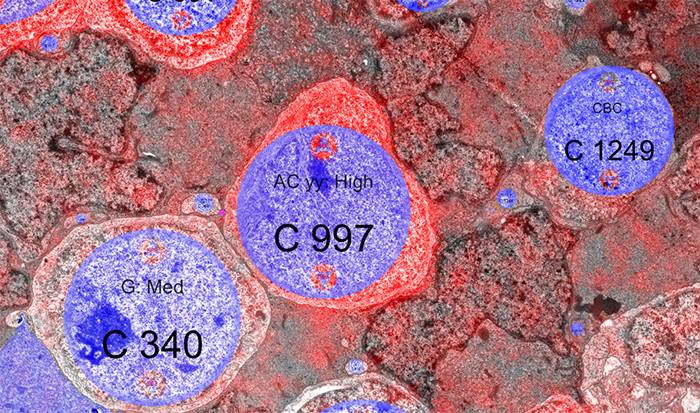
Retinal remodeling is a consequence of retinal degenerative disease, during which neurons sprout new neurites whose synaptic structures and partners are not yet defined. Simultaneously during remodeling, Müller cells (MCs) undergo structural and metabolic changes, whose impact on surrounding neurons is an active area of research. Retinal connectomes have elucidated and validated fundamental networks. These data provide further classification of neuronal types and subtypes and a precise framework for modeling of retinal function, based on ground truth networks. The creation of the first pathoconnectome (RPC1), a connectome from pathological retinal tissue, provides the opportunity to determine connectivites between neurons, while simultaneously evaluating glial remodeling. Computational Molecular Phenotyping (CMP) embedded within the ultrastructure provides metabolic factors of pathologies.

Methods:
RPC1 was collected post-mortem from a 10mo TgP347L rabbit model of adRP, fixed in 1% FA, 2.5% GA, 3% sucrose, and 1mM MgSO4 in cacodylate buffer (pH 7.4). The tissue was osmicated, dehydrated, resin embedded, and sectioned at 70nm. Sections were placed on formvar grids, stained, and imaged on a JEOL JEM-1400 TEM using SerialEM. 1 section was reserved from every 30 section for CMP, where it was probed for small molecules: glutamate, glutamine, glycine, GABA, taurine, glutathione; or proteins GFAP and GS. RPC1 was evaluated using the Viking software suite.

Results:
RPC1 was chosen based on early features of retinal degeneration/remodeling: degeneration of rod OS, MC hypertrophy, and neuronal sprouting. RPC1 consists of 948 serial sections spanning the ONL to the vitreous, with a diameter of 90µm. We find dendrites extending from rod bipolar cells to cone pedicles, originally described in light microscopy, and active synaptic contacts. We also see alterations of synaptic structure in the IPL, and MC morphological changes affecting surface to volume and neuron/glial relationships. Network motifs are being actively investigated.

Conclusions:
We observe many features of remodeling previously described using light microscopy, and confirm active synaptic contact. We also find synaptic structural features, not previously described. In addition, early evaluation of MC morphology demonstrates marked changes in MC shape and associations with nearby neurons and glia, which, combined with CMP, will be instrumental in understanding how MCs affect retinal remodeling.

Impact of Glaucoma On Retinal Ganglion Cell Subtypes: A Single-Cell RNA-seq Analysis of the DBA/2J Mouse

This abstract was presented today, May 1st at the 2018 Association for Research in Vision and Opthalmology (ARVO) meetings in Honolulu, Hawaii by Siamak Yousefi, Hao Chen, Jesse Ingels, Sumana R. Chintalapudi, Megan Mulligan, Bryan W. Jones, Vanessa Marie Morales-Tirado, Pete Williams, Simon W. John, Felix Struebing, Eldon E. Geisert, Monica Jablonski, Lu Lu, Robert Williams

Purpose
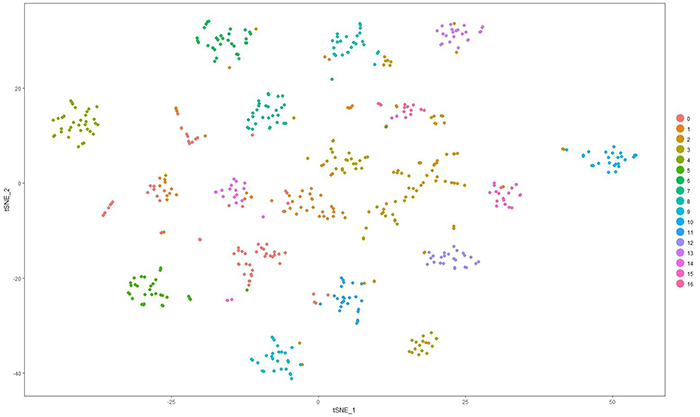
We are developing methods to define molecular signatures of cellular stress during early stages of glaucoma for major subtypes of retinal ganglion cells (RGCs). Our first aim is to develop reliable mRNA biomarkers for RGC subtypes in the DBA/2J (D2) mouse model prior to disease onset. Our second objective is to quantify cellular stress in RGC subtypes at early stages of disease using known sets of stress-responsive transcripts (e.g. Struebing et al, 2016 PMID:27733864; Williams et al. 2017, PMID:28209901; Lu et al, ARVO 2018).

Methods
Whole retinas from D2 or D2.Cg-Tg(Thy1-CFP)23Jrs/SjJ at 130 to 150 days-of-age were dissociated gently and size selected (>10 µm). RGCs were enriched using THY1 antibody-coated beads. Fluidigm HT microfluidics plates were used to isolate and generate scRNA-seq libraries of full length polyA-positive mRNAs using SMART-Seq v4. Libraries were sequenced using HiSeq3000, PE151. Following alignment using STAR, expression was normalized to log2(FPKM+1) across ~25,000 unique transcript models. Cells with fewer than 1000 detected genes and genes expressed in fewer than 1% of RGCs were excluded. Sets of genes with high variance and/or high expression were used for principal component analysis (PCA). Twenty PCs were used for graph-based unsupervised clustering and visualized using t-distributed stochastic neighbor embedding (tSNE). Gene specificity was computed for all transcripts across all clusters. The top transcripts per cluster with expression >1 in 1% or more of cells, were used to diagnose cellular identify of clusters. The top 30 genes per cluster were searched in PubMed against a panel of cell and tissue specific terms using Chilibot.

Results
The scRNA-seq protocol generates 150,000 – 200,000 uniquely mapped mRNA reads/cell and ~5000 genes/cells. We currently have 1600 cells, of which over half are RGCs. Around 75% of cells are positive for two or more of the following RGC markers: Thy1, Rbpms, Rbpms2, Jam2, G3bp1, and Ywhaz. This set of cells and different subsets of genes are now being used for RGC clustering. We have identified at least 17 clusters in initial datasets using these protocols and are now linking clusters to major classes of RGCs.

Conclusions
Molecular signatures of cellular stress and RGC subtypes in early stage of glaucoma should now be identifiable using unsupervised learning techniques.

Circuit Remodeling In Retinal Degeneration

This abstract was presented yesterday, April 29th at the 2018 Association for Research in Vision and Opthalmology (ARVO) meetings in Honolulu, Hawaii by Bryan W. Jones.

Abstract:

The retina is a complex, heterocellular tissue with most/all retinal cell classes becoming impacted or altered in retinitis pigmentosa (RP) and age-related macular degeneration (AMD) in a process called retinal remodeling. Defining disease and the stage-specific cytoarchitectural and metabolic responses in RP and AMD is critical for highlighting targets for intervention. We now know that negative plasticity and neural retinal remodeling occurs regardless of retinal insult in models of retinal degeneration as well as in human RP and in human AMD, revealing that no retinal disease fails to trigger remodeling and reprogramming.

Evidence in the literature over the past decade has improved our understanding into mechanisms of initial retinal degeneration and informed our understanding of the subsequent remodeling events in the neural retina that occur post-photoreceptor degeneration. Remodeling associated with retinal degeneration is intimately linked with insults that cause photoreceptor stress and eventually photoreceptor cell death. These phenomena result in reprogramming of cell types in retina followed by progressive neural degeneration akin to CNS neural degenerations involving both neuronal and glial classes. No cell class in the retina is spared from the effects of remodeling. The earliest cell classes involved in remodeling are horizontal, bipolar and Müller cells and the Müller glia are the last cell class left in the remodeling retina.

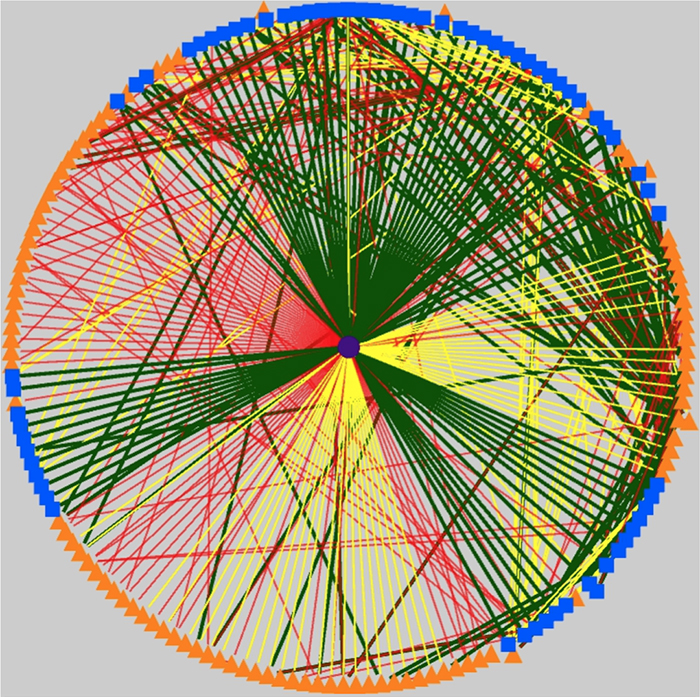
Our efforts are now focused on elucidating the precise wiring changes in retina, through the creation of pathological connectomes, or “patho-connectomes” to study precisely what the circuit topologies are, compared to normal topologies derived from Retinal Connectome 1 (RC1).  Also, because temporal windows are critical to understanding when interventions may be possible, we are exploring when circuit topology revisions occur to understand their impact on information flow in the retina and their impact on rescues of vision loss.  Precise circuit topologies in early retinal degenerative events is our first area of exploration with ultrastructural reconstructions of outer retinal neurons, bipolar cells and horizontal cells.  Müller glia are also of intense interest as we are tracking the earliest metabolic and morphological changes in glia in response to retinal degenerations.

Metabolic, Excitation and Functional Mapping of Diabetic Retinopathy

This abstract was presented today, Monday, April 30th at the 2018 Association for Research in Vision and Opthalmology (ARVO) meetings in Honolulu, Hawaii by Felix R. Vazquez-Chona, Tam T.T. Phuong, Oleg Yarishkin, Bryan W. Jones, and David Krizaj

Purpose:
Loss of vision in diabetic retinopathy is associated with extensive shifts in retinal metabolic and synaptic function yet the general principles that govern the metabolic remodeling remain unknown. To define the metabolic signature in hyperglycemic retina we took advantage of in situ metabolomics, excitation mapping and gene knockdown. Specifically, we investigated whether manipulation of the swelling-activated calcium-permeable TRPV4 (transient receptor potential isoform 4) channel contributes to the metabolic program of the degenerating neurogliovascular subunit in diabetic mice.

Methods:
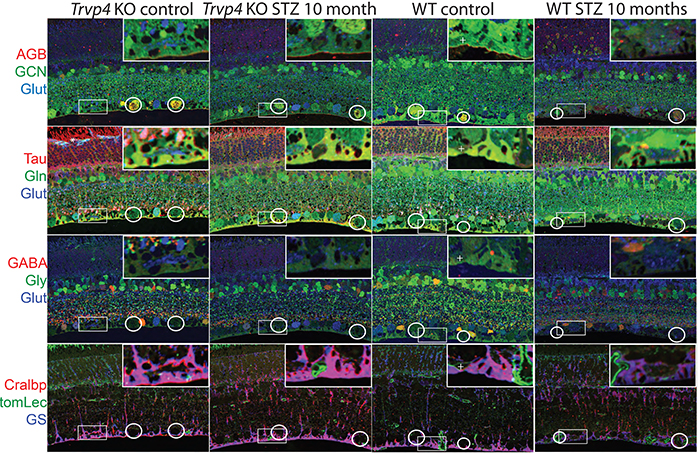
Type I diabetes in wild type (WT) and TRPV4-/- mice was induced with streptozotocin (STZ). We visualized glutamate (NMDA)-gated excitation and glucose transport using the organic cation agmatine (AGB2+) and the glucose analog glucosamine (GCN). Retinas were fixed in glutaraldehyde, sectioned, and incubated with antibodies targeting GCN and AGB. Cell classification and metabolic status were interrogated using Computational Metabolic Profiling (CMP) and probes against ADP, alanine, arginine, aspartate, citrulline, GABA, glutamate, glycine, glutathione, glutamine, isoleucine, taurine, glutamine synthetase, CRALBP, GFAP, and tomato lectin.

Results:
Amacrine and ganglion cells in control retinas responded to NMDA activation with a large elevations in AGB and GCN signals. Diabetic amacrine cells maintained a robust dynamic range of AGB and GCN signals which however were markedly diminished in RGCs. Metabolomic maps of diabetic WT retinas showed that the outer retina remains metabolically quiescent whereas the ganglion cell layer displayed cells with lower glutamate and GABA signals. Diabetic TRPV4-deficient retinas displayed metabolomic, excitation, and glucose transport maps that were comparable to control retinas. ERG analysis showed modest STZ-induced changes in scotopic a- and b-waves of WT and KO eyes.

Conclusions:
Our preliminary electrophysiological and metabolomic findings suggest that STZ-induced diabetes spares the inner retina but alters amacrine-ganglion cell signaling, the neurogliovascular unit organization together with RGC metabolism. TRPV4 inactivation partially rescues the metabolic, excitation, physiologic phenotypes imposed by hyperglycemia. These results suggest that ambient sensing through polymodal TRP channels links retinal neuronal, glial and endothelial signaling to cellular metabolism and visual function.

Corticostriatal Circuit Defects in Hoxb8 Mutant Mice

We have a new publication in Molecular Psychiatry, Corticostriatal circuit defects in Hoxb8 mutant mice. (Direct link here).  Authors are:  Naveen Nagarajan, Bryan W. Jones, Peter West, Robert Marc, and Mario R. Capecchi.

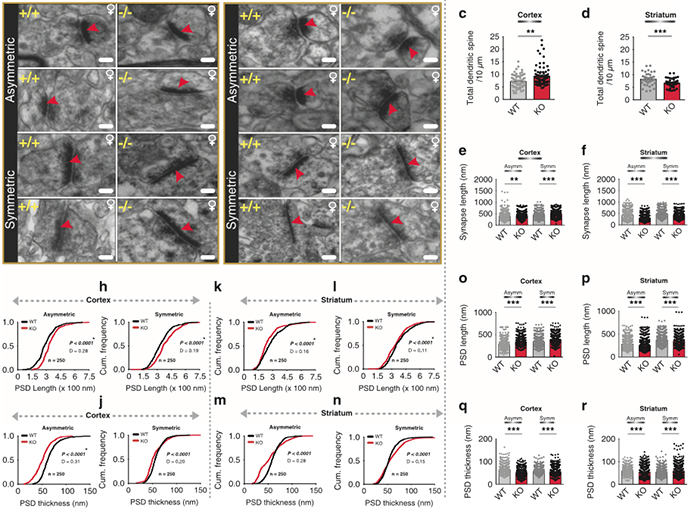
Abstract: Hoxb8 mutant mice exhibit compulsive grooming and hair removal dysfunction similar to humans with the obsessive-compulsive disorder (OCD)-spectrum disorder, trichotillomania. As, in the mouse brain, the only detectable cells that label with Hoxb8 cell lineage appear to be microglia, we suggested that defective microglia cause the neuropsychiatric disorder. Does the Hoxb8 mutation in microglia lead to neural circuit dysfunctions? We demonstrate that Hoxb8 mutants contain corticostriatal circuit defects. Golgi staining, ultra-structural and electrophysiological studies of mutants reveal excess dendritic spines, pre- and postsynaptic structural defects, long-term potentiation and miniature postsynaptic current defects. Hoxb8 mutants also exhibit hyperanxiety and social behavioral deficits similar to mice with neuronal mutations in Sapap3, Slitrk5 and Shank3, reported models of OCD and autism spectrum disorders (ASDs). Long-term treatment of Hoxb8 mutants with fluoxetine, a serotonin reuptake inhibitor, reduces excessive grooming, hyperanxiety and social behavioral impairments. These studies provide linkage between the neuronal defects induced by defective Hoxb8-microglia and neuronal dysfunctions directly generated by mutations in synaptic components that result in mice, which display similar pathological grooming, hyperanxiety and social impairment deficits. Our results shed light on Hoxb8 microglia-driven circuit-specific defects and therapeutic approaches that will become essential to developing novel
therapies for neuropsychiatric diseases such as OCD and ASDs with Hoxb8-microglia being the central target.

Pattern Recognition Analysis Reveals Unique Contrast Sensitivity Isocontours Using Static Perimetry Thresholds Across The Visual Field

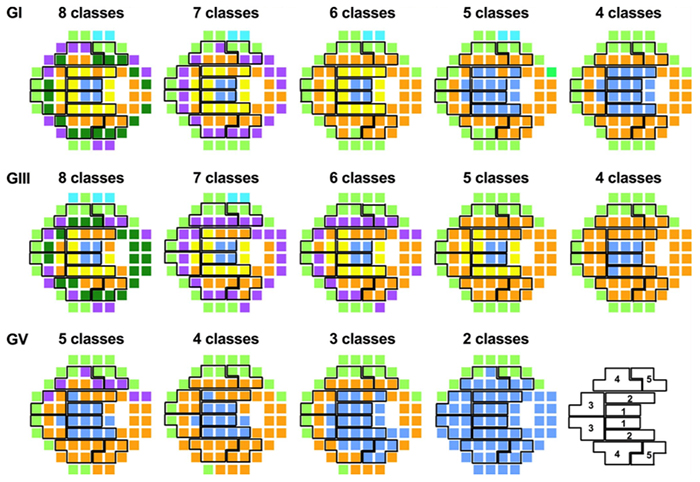
We have a new publication in IOVS, Pattern Recognition Analysis Reveals Unique Contrast Sensitivity Isocontours Using Static Perimetry Thresholds Across The Visual Field (Direct link here).  Authors are:  Jack Phu, Sieu Khuu, Lisa Nivison-Smith, Barbara Zangerl, Agnes Yiu, Jeung Choi, Bryan W. JonesRebecca Pfeiffer, Robert Marc, and Michael Kalloniatis.

Purpose
To determine the locus of test locations that exhibit statistically similar age-related decline in sensitivity to light increments and age-corrected contrast sensitivity isocontours (CSIs) across the central visual field (VF). We compared these CSIs with test point clusters used by the Glaucoma Hemifield Test (GHT).

Methods
Sixty healthy observers underwent testing on the Humphrey Field Analyzer 30-2 test grid using Goldmann (G) stimulus sizes I-V. Age-correction factors for GI-V were determined using linear regression analysis. Pattern recognition analysis was used to cluster test locations across the VF exhibiting equal age-related sensitivity decline (age-related CSIs), and points of equal age-corrected sensitivity (age-corrected CSIs) for GI-V.

Results
There was a small but significant test size–dependent sensitivity decline with age, with smaller stimuli declining more rapidly. Age-related decline in sensitivity was more rapid in the periphery. A greater number of unique age-related CSIs was revealed when using smaller stimuli, particularly in the mid-periphery. Cluster analysis of age-corrected sensitivity thresholds revealed unique CSIs for GI-V, with smaller stimuli having a greater number of unique clusters. Zones examined by the GHT consisted of test locations that did not necessarily belong to the same CSI, particularly in the periphery.

Conclusions
Cluster analysis reveals statistically significant groups of test locations within the 30-2 test grid exhibiting the same age-related decline. CSIs facilitate pooling of sensitivities to reduce the variability of individual test locations. These CSIs could guide future structure-function and alternate hemifield asymmetry analyses by comparing matched areas of similar sensitivity signatures.