Rebecca Pfeiffer, a post-doc in the laboratory presented her work on “Pathoconnectome Analysis of Müller Cells in Early Retinal Remodeling” as a platform presentation at the RD2018 meeting in Killarney, Ireland.
Authors: Rebecca Pfeiffer, James R. Anderson, Daniel P. Emrich, Jeebika Dahal, Crystal L Sigulinsky, Hope AB Morrison, Jia-Hui Yang, Carl B. Watt, Kevin D. Rapp, Mineo Kondo, Hiroko Terasaki, Jessica C Garcia, Robert E. Marc, and Bryan W. Jones.
Purpose: Glia play important roles in neural system function. These roles include, but are not limited to: amino acid recycling, ion homeostasis, glucose transport, and removal of waste. During retinal degeneration, Muller cells, the primary macroglia of the retina, are one of the first cells to show metabolic and morphological alterations in response to retinal stress. The metabolic alterations observed in Muller cells appear to manifest in regions of photoreceptor degeneration; however, the precise mechanisms that govern these alterations in response to neuronal stress, synapse maintenance, or glia-glia interactions is currently unknown. This project aims to reconstruct Muller cells from a pathoconnectome of early retinal remodeling at 2nm/pixel with ultrastructural metabolic data to determine the relationship of structural and metabolic phenotypes between neighboring neurons and glia.
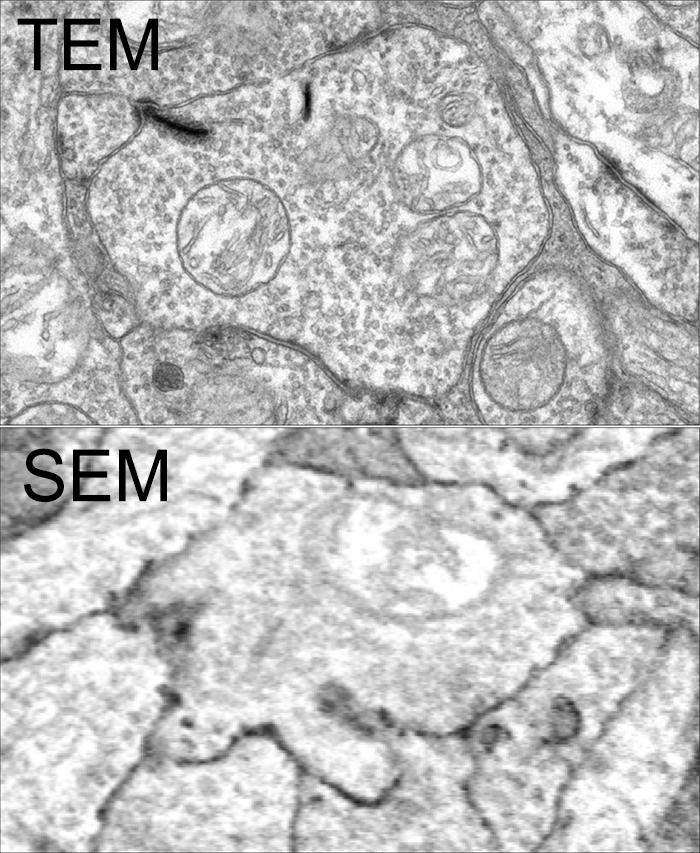
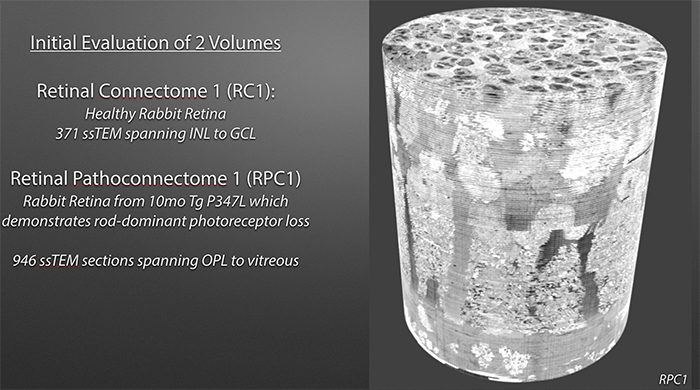
Methods: Retinal pathoconnectome 1 (RPC1) is the first connectome to be assembled from pathologic neural tissue (a pathoconnectome). The tissue selected for RPC1 was collected post mortem from a 10 month transgenic P347L rabbit model of autosomal dominant retinitis pigmentosa, fixed in 1% formaldehyde, 2.5% glutaraldehyde, 3% sucrose, and 1mM MgSO4 in cacodylate buffer (pH 7.4). The tissue was subsequently osmicated, dehydrated, resin embedded, and sectioned at 70nm. Sections were placed on formvar grids, stained, and imaged at 2nm/pixel on a JEOL JEM-1400 TEM using SerialEM software. 1 section was reserved from every 30 sections for CMP, where it was placed on a slide and probed for small molecules: glutamate, glutamine, glycine, GABA, taurine, glutathione; or TEM compatible proteins GFAP and GS. The pathoconnectome volume was evaluated and annotated using the Viking software suite.
Results: RPC1 demonstrates hallmarks of early retinal degeneration and remodeling, including the glial phenotypes of hypertrophy and metabolic variation between neighboring Muller cells. Early evaluation of these glia demonstrates variations in osmication in Muller cells as well as apparent encroachment of glial end-feet on one another. We are currently in the process of reconstructing multiple Muller cells within RPC1 and their neighboring neurons. Once complete, we will assess the relationship between Muller cell phenotype and the phenotypes of contacted neuronal and glial neighbors.
Conclusions: How neural-glial relationships are affected by retinal remodeling may help us understand why remodeling and neurodegeneration follow photoreceptor degeneration. In addition, determining these relationships during remodeling will be crucial to developing therapeutics with long-term success. RPC1 provides a framework to analyze these relationships in early retinal remodeling through ultrastructural reconstructions of all neurons and glia in an intact retina. These reconstructions, informed by quantitative metabolite labeling, will allow us to evaluate these neural-glial interactions more comprehensively than other techniques have previously allowed.