Category Archives: Abstracts

A Pathoconnectome of Early Retinal Remodeling

This abstract was presented today, Monday, April 30th at the 2018 Association for Research in Vision and Opthalmology (ARVO) meetings in Honolulu, Hawaii by Rebecca Pfeiffer, Robert E. Marc, James R. Anderson, Daniel P. Emrich, Carl B. Watt, Jia-Hui Yang, Kevin D. Rapp, Jeebika Dahal, Mineo Kondo, Hiroko Terasaki, and Bryan W. Jones.

Purpose:
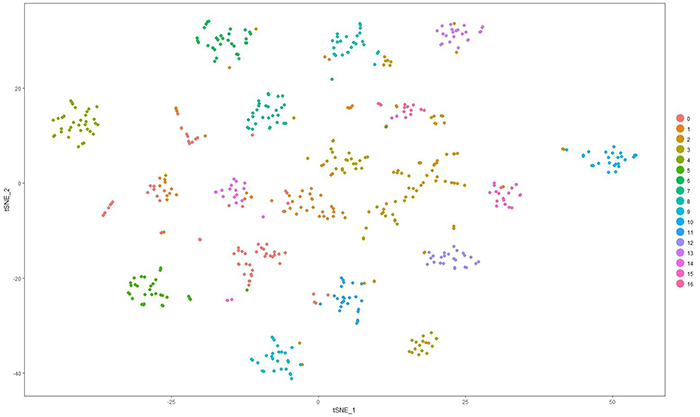
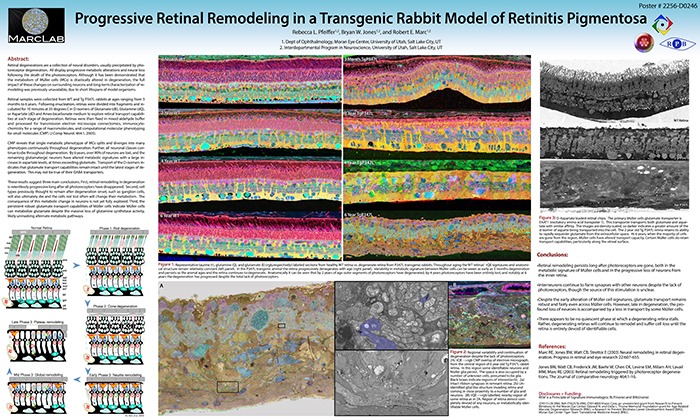
Retinal remodeling is a consequence of retinal degenerative disease, during which neurons sprout new neurites whose synaptic structures and partners are not yet defined. Simultaneously during remodeling, Müller cells (MCs) undergo structural and metabolic changes, whose impact on surrounding neurons is an active area of research. Retinal connectomes have elucidated and validated fundamental networks. These data provide further classification of neuronal types and subtypes and a precise framework for modeling of retinal function, based on ground truth networks. The creation of the first pathoconnectome (RPC1), a connectome from pathological retinal tissue, provides the opportunity to determine connectivites between neurons, while simultaneously evaluating glial remodeling. Computational Molecular Phenotyping (CMP) embedded within the ultrastructure provides metabolic factors of pathologies.

Methods:
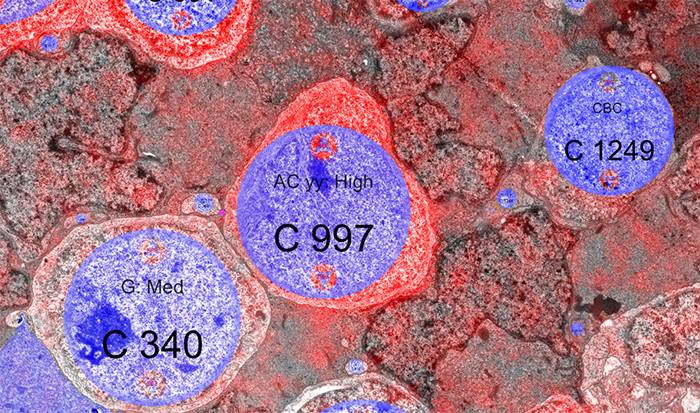
RPC1 was collected post-mortem from a 10mo TgP347L rabbit model of adRP, fixed in 1% FA, 2.5% GA, 3% sucrose, and 1mM MgSO4 in cacodylate buffer (pH 7.4). The tissue was osmicated, dehydrated, resin embedded, and sectioned at 70nm. Sections were placed on formvar grids, stained, and imaged on a JEOL JEM-1400 TEM using SerialEM. 1 section was reserved from every 30 section for CMP, where it was probed for small molecules: glutamate, glutamine, glycine, GABA, taurine, glutathione; or proteins GFAP and GS. RPC1 was evaluated using the Viking software suite.

Results:
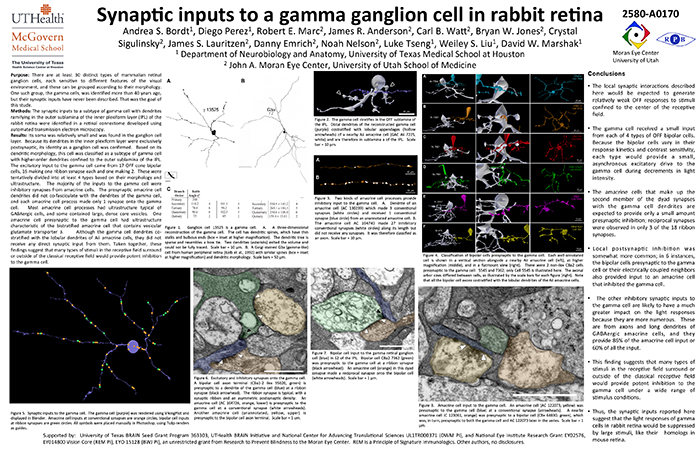
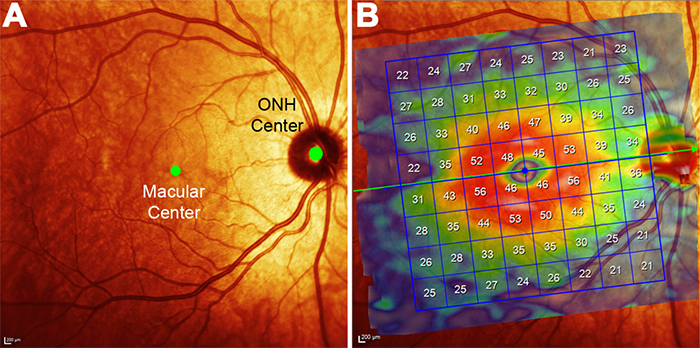
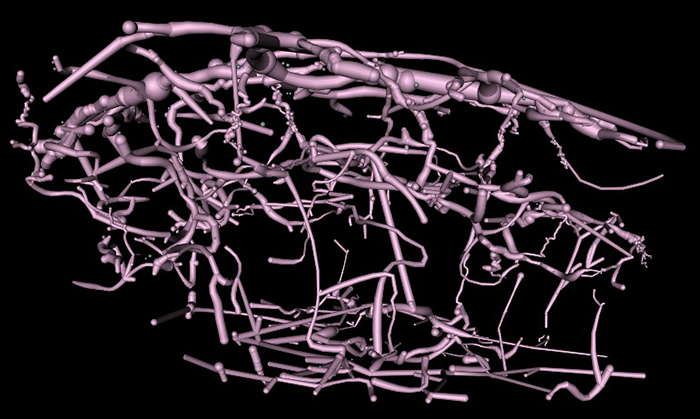
RPC1 was chosen based on early features of retinal degeneration/remodeling: degeneration of rod OS, MC hypertrophy, and neuronal sprouting. RPC1 consists of 948 serial sections spanning the ONL to the vitreous, with a diameter of 90µm. We find dendrites extending from rod bipolar cells to cone pedicles, originally described in light microscopy, and active synaptic contacts. We also see alterations of synaptic structure in the IPL, and MC morphological changes affecting surface to volume and neuron/glial relationships. Network motifs are being actively investigated.

Conclusions:
We observe many features of remodeling previously described using light microscopy, and confirm active synaptic contact. We also find synaptic structural features, not previously described. In addition, early evaluation of MC morphology demonstrates marked changes in MC shape and associations with nearby neurons and glia, which, combined with CMP, will be instrumental in understanding how MCs affect retinal remodeling.

Impact of Glaucoma On Retinal Ganglion Cell Subtypes: A Single-Cell RNA-seq Analysis of the DBA/2J Mouse

This abstract was presented today, May 1st at the 2018 Association for Research in Vision and Opthalmology (ARVO) meetings in Honolulu, Hawaii by Siamak Yousefi, Hao Chen, Jesse Ingels, Sumana R. Chintalapudi, Megan Mulligan, Bryan W. Jones, Vanessa Marie Morales-Tirado, Pete Williams, Simon W. John, Felix Struebing, Eldon E. Geisert, Monica Jablonski, Lu Lu, Robert Williams

Purpose
We are developing methods to define molecular signatures of cellular stress during early stages of glaucoma for major subtypes of retinal ganglion cells (RGCs). Our first aim is to develop reliable mRNA biomarkers for RGC subtypes in the DBA/2J (D2) mouse model prior to disease onset. Our second objective is to quantify cellular stress in RGC subtypes at early stages of disease using known sets of stress-responsive transcripts (e.g. Struebing et al, 2016 PMID:27733864; Williams et al. 2017, PMID:28209901; Lu et al, ARVO 2018).

Methods
Whole retinas from D2 or D2.Cg-Tg(Thy1-CFP)23Jrs/SjJ at 130 to 150 days-of-age were dissociated gently and size selected (>10 µm). RGCs were enriched using THY1 antibody-coated beads. Fluidigm HT microfluidics plates were used to isolate and generate scRNA-seq libraries of full length polyA-positive mRNAs using SMART-Seq v4. Libraries were sequenced using HiSeq3000, PE151. Following alignment using STAR, expression was normalized to log2(FPKM+1) across ~25,000 unique transcript models. Cells with fewer than 1000 detected genes and genes expressed in fewer than 1% of RGCs were excluded. Sets of genes with high variance and/or high expression were used for principal component analysis (PCA). Twenty PCs were used for graph-based unsupervised clustering and visualized using t-distributed stochastic neighbor embedding (tSNE). Gene specificity was computed for all transcripts across all clusters. The top transcripts per cluster with expression >1 in 1% or more of cells, were used to diagnose cellular identify of clusters. The top 30 genes per cluster were searched in PubMed against a panel of cell and tissue specific terms using Chilibot.

Results
The scRNA-seq protocol generates 150,000 – 200,000 uniquely mapped mRNA reads/cell and ~5000 genes/cells. We currently have 1600 cells, of which over half are RGCs. Around 75% of cells are positive for two or more of the following RGC markers: Thy1, Rbpms, Rbpms2, Jam2, G3bp1, and Ywhaz. This set of cells and different subsets of genes are now being used for RGC clustering. We have identified at least 17 clusters in initial datasets using these protocols and are now linking clusters to major classes of RGCs.

Conclusions
Molecular signatures of cellular stress and RGC subtypes in early stage of glaucoma should now be identifiable using unsupervised learning techniques.

Circuit Remodeling In Retinal Degeneration

This abstract was presented yesterday, April 29th at the 2018 Association for Research in Vision and Opthalmology (ARVO) meetings in Honolulu, Hawaii by Bryan W. Jones.

Abstract:

The retina is a complex, heterocellular tissue with most/all retinal cell classes becoming impacted or altered in retinitis pigmentosa (RP) and age-related macular degeneration (AMD) in a process called retinal remodeling. Defining disease and the stage-specific cytoarchitectural and metabolic responses in RP and AMD is critical for highlighting targets for intervention. We now know that negative plasticity and neural retinal remodeling occurs regardless of retinal insult in models of retinal degeneration as well as in human RP and in human AMD, revealing that no retinal disease fails to trigger remodeling and reprogramming.

Evidence in the literature over the past decade has improved our understanding into mechanisms of initial retinal degeneration and informed our understanding of the subsequent remodeling events in the neural retina that occur post-photoreceptor degeneration. Remodeling associated with retinal degeneration is intimately linked with insults that cause photoreceptor stress and eventually photoreceptor cell death. These phenomena result in reprogramming of cell types in retina followed by progressive neural degeneration akin to CNS neural degenerations involving both neuronal and glial classes. No cell class in the retina is spared from the effects of remodeling. The earliest cell classes involved in remodeling are horizontal, bipolar and Müller cells and the Müller glia are the last cell class left in the remodeling retina.

Our efforts are now focused on elucidating the precise wiring changes in retina, through the creation of pathological connectomes, or “patho-connectomes” to study precisely what the circuit topologies are, compared to normal topologies derived from Retinal Connectome 1 (RC1).  Also, because temporal windows are critical to understanding when interventions may be possible, we are exploring when circuit topology revisions occur to understand their impact on information flow in the retina and their impact on rescues of vision loss.  Precise circuit topologies in early retinal degenerative events is our first area of exploration with ultrastructural reconstructions of outer retinal neurons, bipolar cells and horizontal cells.  Müller glia are also of intense interest as we are tracking the earliest metabolic and morphological changes in glia in response to retinal degenerations.

Synaptic Inputs To A Gamma Ganglion Cell In Rabbit Retina

This abstract was presented today, May 8th at the 2017 Association for Research in Vision and Opthalmology (ARVO) meetings in Baltimore, Maryland by Andrea Bordt, Diego Perez, Robert E. Marc, James R. Anderson, Carl B. Watt, Bryan W. Jones, Crystal Sigulinsky, James S. Lauritzen, Danny Emrich, Noah Nelson, Luke Tseng, Weiley Liu, and David W. Marshak. Full resolution version here.

Purpose: There are at least 30 distinct types of mammalian retinal ganglion cells, each sensitive to different features of the visual environment, and these can be grouped according to their morphology. One such group, the gamma cells, was identified more than 40 years ago, but their synaptic inputs have never been described. That was the goal of this study.

Methods: The synaptic inputs to a subtype of gamma cell with dendrites ramifying in the outer sublamina of the inner plexiform layer (IPL) of the rabbit retina were identified in a retinal connectome developed using automated transmission electron microscopy.

Results: The gamma cell was always postsynaptic in the IPL, confirming its identity as a ganglion cell. The local synaptic input should produce relatively weak OFF reposnses to stimuli confined to the center of the gamma cell’s receptive field. It typically received only one synapse per bipolar cell from at least 4 types of OFF bipolar cells. Because bipolar cells vary in their response kinetics and contrast sensitivity. each type would provide a small, asynchronous excitatory input. The amacrine cells at the dyad synapses provided only a small amount presynaptic inhibition; reciprocal synapses were observed in only 3 of the 18 ribbon synapses. There was no glycinergic crossover inhibition, another local interaction that would enhance light responses. Local postsynaptic inhibition was somewhat more common; in 6 instances, the bipolar cells presynaptic to the gamma cell or their electrically coupled neighbors also provided input to an amacrine cell that inhibited the gamma cell. The other amacrine cell inputs to the gamma cell should have a much greater impact on the light responses because they are far more numerous. These are from axons and long dendrites of GABAergic amacrine cells, and they provide 60% of all the input. This finding suggests that many types of stimuli in the receptive field surround or outside of the classical receptive field would provide potent inhibition to the gamma cell.

Conclusions: The synaptic inputs rsuggest that gamma cells in rabbit retina would have light responses like their homologs in mouse retina, OFF responses to small stimuli in the receptive field center that are suppressed by a variety of larger stimuli. Thus, they would signal object motion selectively.

Predicting Age-related Changes with High Accuracy using a Pattern Recognition Derived Retinal Ganglion Cell Regression Model

This abstract was presented yesterday, May 7th at the 2017 Association for Research in Vision and Opthalmology (ARVO) meetings in Baltimore, Maryland by Nayuta Yoshioka, Barbara Zangerl, Lisa Nivison-Smith, Sieu Khuu, Bryan W. Jones, Rebecca Pfeiffer, Robert Marc, and Michael Kalloniatis.

Purpose: We recently used pattern recognition analysis to show macula areas can be classified into statistically distinct clusters in accordance to their age-related retinal ganglion cell layer (RGCL) thickness change in a normal population. The aim of this study was to perform a retrospective cross-sectional analysis utilizing a large cohort of patients to establish accuracy of this model and to develop a normative dataset using a 50-year-old equivalent cohort.

Methods: Data was collected from patients seen at the Centre for Eye Health for optic nerve assessment without posterior pole disease. The grid-wise RGCL thickness was obtained from a single eye of each patient via Spectralis OCT macular scan over an 8×8 measurement grid. Measurements for patients outside the 45-54 age range (training cohort) were converted to 50-year-old equivalent value utilizing pattern recognition derived regression model which, in brief, consists of 8×8 grid clustered into 8 distinct classes according to the pattern of RGCL thickness change with age. Accuracy of the predictions was assessed by comparing the training cohort’s measurements to the 45-54 year reference cohort using t-test and one-way ANOVA.

Results: Data were collected from a total 248 patients aged 20 to 78.1 years. 80 patients within this group were aged 45 – 54 and formed the reference cohort (average±SD 49.6±2.83) and the remaining 168 eyes formed the training cohort (average age±SD 50.7±17.34). Converted values for the training set matched those of the reference cohort (average disparity±SD 0.10±0.42µm, range -0.74-1.34µm) and were not significantly different (p > 0.9). Most variability was observed with patients above 70 years of age (average disparity±SD -0.09±1.73µm, range -3.67 to 6.16µm) and central grids corresponding to the fovea (average disparity±SD 0.47±0.72µm, range -0.22 to 1.34µm).

Conclusions: Our regression model for normal age-related RGCL change can accurately convert and/or predict RGCL thickness for individuals in comparison to 50-year-equivalent reference cohort and could allow for more accurate assessment of RGCL thickness and earlier detection of significant loss in the future. Caution may be needed when applying the model in the foveal area or for patients older than 70 years.

Metabolic Impacts of Cigarette Smoke On The Retina of Complement-Compromised Mice

This abstract was presented today, May 8th at the 2017 Association for Research in Vision and Opthalmology (ARVO) meetings in Baltimore, Maryland by Felix Vazquez-Chona, Alex Butler, Emile McKinnon, Baerbel Rohrer, and Bryan W. Jones. Full resolution version here.

Purpose: The interaction between metabolism and the immune system is hypothesized as playing a central role in the pathology of neural diseases including Age-Related Macular Degeneration (AMD). We investigated the effects of cigarette-smoke exposure (CSE) on metabolism of retinal cells in wild-type (wt) mice, and mice deficient for the alternative pathway (complement factor B, CfB) or common terminal pathway (complement component 3, C3).

Methods: Mice were exposed to CSE or room filtered-air (controls) for 6 h/d, 5 d/wk for 6 months. We visualized the metabolism of retinal cells using Computational Molecular Phenotyping (CMP). Retinal cell classification and metabolic adaptation were interrogated using arginine (R), aspartate (D), GABA (γ), glutamate (E), glycine (G), glutathione (J), glutamine (Q), taurine (τ), glutamine synthetase (GS), and cellular retinaldehyde binding protein (CRALBP). Electron microscope mosaics were instrumental in phenotyping metabolic profiles.

Results: CSE C3-/- animals show more severe degenerative indices than CSE WT: retinal pigment epithelium (RPE) exhibited a decreased basalateral infolding area and increased vacuolization; photoreceptors show increased mitochondrial swelling and pyknosis; Müller glia displayed hypertrophy; and the amacrine layer was affected by increased vacuolization. The CfB-/- retina was more resilient to the negative effects of CSE when compared to the WT retina. At the metabolic level, RPE and inner segments of CSE CfB-/- mice displayed modest changes. In contrast, changes in CSE C3-/- and WT retina were dramatic: RPE exhibited decreased CRALBP and elevated R-E-J-τ-γ levels; inner segments showed increased R-D-E-G-J-Q-τ-γ-CRALBP; and Müller glia were found to have decreased levels along the R-D-E-G-J-Q-τ-γ-GS-CRALBP axis.

Conclusions: Increased GABA levels in RPE and photoreceptors are consistent with Müller glia dysfunction. Our metabolic profiling suggests that RPE and Müller glia are vulnerable to CSE-induced oxidative stress. We also find that the potential complement activation status of the retina-RPE-choroid unit highly influences the metabolic response of retinal cells to CSE. As complete blockade of the complement system in the C3-/- model has a more dramatic impact on metabolism of RPE, Müller glia, and photoreceptors than observed in the CfB-/- model, it can be proposed that downstream signaling of the complement system is required for retina health.

Layman Abstract: Metabolism involves a complex circuitry of metabolic pathways, intermediates, and cell-cell interactions. Thus, mapping metabolism with cellular resolution and quantitative power is key to identifying robust biomarkers of disease progression.

Pattern Recognition Reveals Different Visual Field Signature Patterns When Using Spatially Equated Test Sizes Compared To Standard Goldmann III Alone

This abstract was presented today, May 2th at the 2016 Association for Research in Vision and Opthalmology (ARVO) meetings in Seattle, Washington by Michael Kalloniatis, Robert E. Marc, Sieu K. Khuu, Jack Phu, Barbara Zangerl, Lisa Nivison-Smith, Bryan W. Jones, and Rebecca L. Pfeiffer. 

Abstract Number: 4745

Author Block: Michael Kalloniatis, Robert E. Marc, Sieu K. Khuu, Jack Phu, Barbara Zangerl, Lisa Nivison-Smith, Bryan W. Jones, Rebecca L. Pfeiffer
1 Centre for Eye Health, SOVS, University of New South Wales, Kensington, New South Wales, Australia; 2 SOVS, UNSW, Sydney, New South Wales, Australia; 3 Univ of Utah/Moran Eye Center, Salt Lake City, Utah, United States

Disclosure Block:Michael Kalloniatis, 2014/094035 A1 (USA) and 13865419.9 (EU) (Code P (Patent) ); Robert E. Marc, None; Sieu K. Khuu, 2014/094035 A1 (USA) and 13865419.9 (EU) (Code P (Patent) ); Jack Phu, None; Barbara Zangerl, None; Lisa Nivison-Smith, None; Bryan W. Jones, None; Rebecca L. Pfeiffer, None

Purpose:To identify areas within the visual field with matching contrast sensitivity (CS) signature patterns as a function of age using pattern recognition and determine the discrimination of CS data when using spatially equated test stimuli compared to the single size Goldmann (G)III alone.

Methods:52 subjects (classified in decade age groups from 20-60+ years) were tested using the Humphrey Visual Field Analyser 30-2 paradigm in full threshold mode for GI to GV. At least two thresholds were obtained per size. Two visual field maps were analyzed: a spatially equated visual field where GI was used centrally, GII mid-peripherally and GIII in the outer rings to place the test size at or close to complete spatial summation and a second where a single GIII was used at all locations. Thresholds were expressed as dB* (Khuu & Kalloniatis, IOVS 2015), converted to pixel values and analyzed using an unsupervised classification using isodata clustering (PCI, Geomatica, Canada). Class separation was extracted across the ages to develop dot plots of decade measures of CS.

Results:The 77 data points across the central 60° visual field can be distilled into 6 functional classes using the spatially equated visual field (Class separation 1). The 6 classes reflect areas in visual space that change in a similar manner across the ages. The use of the single GIII target resulted in only 4 classes displaying a poorer discrimination over the central visual field (Class separation 2). Extracted dot plots from class separation illustrated average CS within each class could be assessed across the decades.

Conclusions:When using spatially equated visual field testing, concentric areas were separated into distinct CS signatures consistent with known visual field sensitivity. We confirmed these areas change systematically with age. GIII failed to discriminate central areas of the 30-2 that likely reflects the fact that this size operates outside complete spatial summation and thus may not be the optimal test size for assessing visual function in the central visual field. More importantly, we showed pattern recognition can be applied to complex visual field data sets to identify common features and age-related visual function changes. This analysis allows regions to be averaged as they are statistically identical: this approach will likely assist structure-function studies.

Progressive Retinal Remodeling In A Transgenic Rabbit Model Of Retinitis Pigmentosa

This poster was presented today, May 2th at the 2016 Association for Research in Vision and Opthalmology (ARVO) meetings in Seattle, Washington by Rebecca L. Pfeiffer, Bryan W. Jones, and Robert E. Marc.

Posterboard #: D0246

Abstract Number: 2256 – D0246

Author Block: Rebecca L. Pfeiffer1,2 , Bryan W. Jones1,2 , Robert E. Marc1,2 
1 Ophthalmology, University of Utah, Salt Lake City, Utah, United States; 2 Interdepartmental Program in Neuroscience, University of Utah, Salt Lake City, Utah, United States

Purpose:Retinal degenerations are a collection of neural disorders, usually precipitated by photoreceptor degeneration. All display progressive metabolic alterations and neural loss following the death of the photoreceptors. Although it has been demonstrated that the metabolism of Müller cells (MCs) is drastically altered in degeneration, the full impact of these changes on surrounding neurons and long-term characterization of remodeling was previously unavailable, due to short lifespans of model organisms.

Methods:Retinal samples were collected from WT and Tg P347L rabbits at ages ranging from 3 months to 6 years. Following enucleation, retinas were divided into fragments and incubated for 10 minutes at 35 degrees C in D-isomers of Glutamate (dE), Glutamine (dQ), or Aspartate (dD) and Ames-bicarbonate medium to explore retinal transport capabilities at each stage of degeneration. Retinas were then fixed in mixed aldehyde buffer and processed for transmission electron microscope connectomics, immunocytochemistry for a range of macromolecules, and computational molecular phenotyping for small molecules (CMP) (J Comp Neurol. 464:1, 2003).

Results:CMP reveals that single metabolic phenotype of MCs splits and diverges into many phenotypes continuously throughout degeneration. Further, all neuronal classes continue to die throughout degeneration. By 6 years, over 90% of neurons are lost, and the remaining glutamatergic neurons have altered metabolic signatures with a large increase in aspartate levels, at times exceeding glutamate. Transport of the D-isomers indicates that glutamate transport capabilities remain intact until the latest stages of degeneration. This may not be true of their GABA transporters.

Conclusions:These results suggest three main conclusions. First, retinal remodeling in degeneration is relentlessly progressive long after all photoreceptors have disappeared. Second, cell types previously thought to remain after degeneration onset, such as ganglion cells, will also ultimately die and the cells not lost often will change their metabolism. The consequence of this metabolic change in neurons is not yet fully explored. Third, the persistent robust glutamate transport capabilities of Müller cells indicate Müller cells can metabolize glutamate despite the massive loss of glutamine synthetase activity, likely unmasking alternate metabolic pathways.

Metabolic Changes During Late Stage Retinal Degeneration In Heterozygous Crx Mutant Cats (CrxRdy/+)

This abstract was presented today, May 2th at the 2016 Association for Research in Vision and Opthalmology (ARVO) meetings in Seattle, Washington by Laurence Occelli, Bryan W. Jones, and Simon M. Petersen-Jones.

Posterboard #: D0250

Abstract Number: 2260 – D0250

Author Block: Laurence M. Occelli, Bryan W. Jones, Simon M. Petersen-Jones
1 Small Animal Clinical Sciences, Michigan State University, East Lansing, Michigan, United States; 2 Ophthalmology, Moran Eye Center, University of Utah, Salt Lake City, Utah, United States

Disclosure Block:Laurence M. Occelli, None; Bryan W. Jones, None; Simon M. Petersen-Jones, None

Purpose: CRX is a transcription factor essential for normal photoreceptor development and survival. The CrxRdy cat has a spontaneous mutation in Crx. Early disease stages in heterozygous cats (CrxRdy/+) mimics severe Leber’s congenital amaurosis. This study investigated the timing and extent of retinal remodeling in the late stages of retinal degeneration. This will help optimizing the best time for therapies such as retinal prosthesis or optogenetics before retinal rewiring and glial scar become too extensive.

Methods: CrxRdy/+ cats from 6 weeks to 10 years of age were investigated. Eyes were fixed in mixed aldehyde buffer and processed for immunocytochemistry for computational molecular phenotyping for macromolecules and small molecules (CMP) including GABA, glycine, glutamate, taurine, glutamine, aspartate, rhodopsin and red green opsin (J Comp Neurol. 464:1 2003). Samples from 5 retinal areas were collected: area centralis, mid- and far-superior as well as mid- and far-inferior regions.

Results: CMP revealed an absence of red green opsin and a decrease in rhodopsin expression with mislocalization to the photoreceptor inner segments (IS) and cell bodies as early as 6 weeks of age. Inner and outer photoreceptor segments (IS/OS) were present but short at 6 weeks of age. By 12 weeks of age, very few of the stunted OS remained and IS were very short. At that age, Müller cells had become activated initiating hypertrophy, and indicating cell stress. By 5 years of age, a Müller cell seal was clearly present disrupting the retinal lamination via glial columns. Migration of inner nuclear layer cells with inverted and everted cells was also observed from an early age as well as horizontal and amacrine cell sprouting. By 5 years of age, microneuromas formations had developed (Fig.1). Extreme thinning and remodeling was observed in the peripheral retina of older animals and retinal pigment epithelium was lost from the area centralis.

Conclusions: This study indicates that retinal degeneration in the CrxRdy/+ cat retina follows the 3 proposed phases of retinal remodeling. As early as 12 weeks of age, some glial reaction to photoreceptor death was observed followed by formation of a glial seal, rewiring and inner nuclear layer cells migration. Finally, microneuroma formation, severe retinal thinning and remodeling was developed.

2-nm Resolution Anatomy of Retinal Neuro-Glial-Vascular Architecture

This abstract was presented today, May 2th at the 2016 Association for Research in Vision and Opthalmology (ARVO) meetings in Seattle, Washington by Jefferson R. Brown, Rebecca L. Pfeiffer, Crystal Sigulinsky, Felix Vazquez-Chona, Daniel Emrich, Bryan W. Jones, Robert E. Marc.

Abstract Number: 995

Author Block: Jefferson R. Brown, Rebecca L. Pfeiffer, Crystal Sigulinsky, Felix Vazquez-Chona, Daniel Emrich, Bryan W. Jones, Robert E. Marc
1 Dept of Ophthalmology, University of Utah, Salt Lake City, Utah, United States

Disclosure Block:Jefferson R. Brown, None; Rebecca L. Pfeiffer, None; Crystal Sigulinsky, None; Felix Vazquez-Chona, None; Daniel Emrich, None; Bryan W. Jones, None; Robert E. Marc, Signature Immunologics (Code I (Personal Financial Interest) )

Purpose:Retinal vasculature is strongly affected by degenerative pathologies and in turn, may also contribute to their progression. However, much of what we understand about the normal, healthy interaction between neurons, glia, and blood vessels at the ultrastructural level is limited to single section electron microscopy. The technology of serial section transmission electron microscopy (ssTEM) extends the high definition of TEM imaging into three dimensions to create volumes, allowing for more thorough visualization and analysis of the vascular-glial-neuronal complex.

Methods:RC2 is a 40TB ssTEM volume of over 1,400 horizontal sections of retinal tissue derived from an adult female C57BL/6J mouse. The tissue sample is 250 um in diameter and spans the outer nuclear layer to the vitreal surface. Baseline resolution is 2.18nm per pixel. Visualization, navigation and metadata annotations of the database are made via the Viking software suite.

Results:Much of the retinal vascular basement membrane directly contacts Muller cells. In the ganglion cell layer, direct basement membrane contact with astrocytes is frequent. Microglia commonly contact the basement membrane, and occasionally direct contact of neurons onto basement membrane was observed. Full 3D reconstruction of all vascular pathways with associated endothelia and pericytes within the volume was completed, demonstrating that all the retinal capillary layers are continuous with one another [Figure].

Conclusions:The presence of occasional direct neuronal contact onto vascular basement membrane supports earlier work by Ochs and colleagues (2000) and suggests the blood-retina barrier does not universally involve retinal glia. However, since such contacts are extremely sparse, it remains to be seen whether this finding has biologic significance, though their existence suggests significance. The RC2 volume is a valuable resource to aid in discovery of defining characteristics of wild type neurovascular architecture.


The intro figure is a side view of reconstruction of all vasculature within the RC2 volume. Vessels at the top of the figure correspond to the outer plexiform layer, while those at the bottom correspond to the ganglion cell layer. This capillary plexus is one continuous structure. Visualization by VikingView software.