Tag Archives: ganglion cell

Heterocellular Coupling Between Amacrine Cells and Ganglion Cells

We have a new paper out In Frontiers in Neural Circuits, Heterocellular Coupling Between Amacrine Cells and Ganglion Cells. This manuscript preprint was published in BioRxiv.

Authors: Robert E. Marc, Crystal Lynn Sigulinsky, Rebecca L. Pfeiffer, Daniel Emrich, James Russel Anderson and Bryan William Jones.

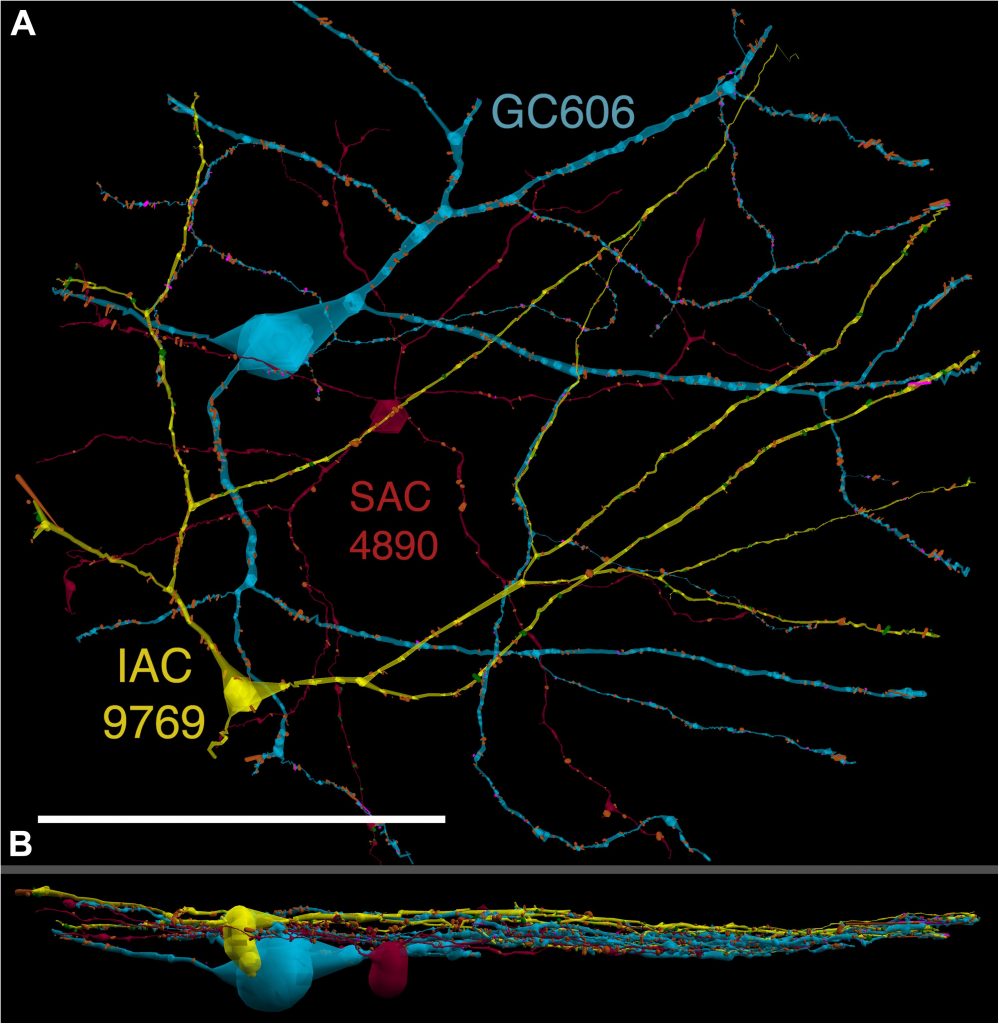
Abstract: All superclasses of retinal neurons, including bipolar cells (BCs), amacrine cells (ACs) and ganglion cells (GCs), display gap junctional coupling. However, coupling varies extensively by class. Heterocellular AC coupling is common in many mammalian GC classes. Yet, the topology and functions of coupling networks remains largely undefined. GCs are the least frequent superclass in the inner plexiform layer and the gap junctions mediating GC-to-AC coupling (GC::AC) are sparsely arrayed amidst large cohorts of homocellular AC::AC, BC::BC, GC::GC and heterocellular AC::BC gap junctions. Here, we report quantitative coupling for identified GCs in retinal connectome 1 (RC1), a high resolution (2 nm) transmission electron microscopy-based volume of rabbit retina. These reveal that most GC gap junctions in RC1 are suboptical. GC classes lack direct cross-class homocellular coupling with other GCs, despite opportunities via direct membrane contact, while OFF alpha GCs and transient ON directionally selective (DS) GCs are strongly coupled to distinct AC cohorts. Integrated small molecule immunocytochemistry identifies these as GABAergic ACs (γ+ ACs). Multi-hop synaptic queries of RC1 connectome further profile these coupled γ+ ACs. Notably, OFF alpha GCs couple to OFF γ+ ACs and transient ON DS GCs couple to ON γ+ ACs, including a large interstitial amacrine cell, revealing matched ON/OFF photic drive polarities within coupled networks. Furthermore, BC input to these γ+ ACs is tightly matched to the GCs with which they couple. Evaluation of the coupled versus inhibitory targets of the γ+ ACs reveals that in both ON and OFF coupled GC networks these ACs are presynaptic to GC classes that are different than the classes with which they couple. These heterocellular coupling patterns provide a potential mechanism for an excited GC to indirectly inhibit nearby GCs of different classes. Similarly, coupled γ+ ACs engaged in feedback networks can leverage the additional gain of BC synapses in shaping the signaling of downstream targets based on their own selective coupling with GCs. A consequence of coupling is intercellular fluxes of small molecules. GC::AC coupling involves primarily γ+ cells, likely resulting in GABA diffusion into GCs. Surveying GABA signatures in the GC layer across diverse species suggests the majority of vertebrate retinas engage in GC::γ+ AC coupling.
Structure-Function Correlation Across The Central Visual Field Using Pointwise Comparisons and Ganglion Cell Isocontours Derived From Pattern Recognition

We presented an abstract for 23rd International visual field and imaging symposium in Kanazawa, Japan on May 12th titled, Structure-function correlation across the central visual field using pointwise comparisons and ganglion cell isocontours derived from pattern recognition.  Authors are:

Kalloniatis M1,2, Tong J1,2, Yoshioka N1,2, Khuu SK2, Phu J1,2, Choi A1,2, Zangerl B1, Nivison-Smith L1,2, Bui BV4, Marc RE3, Jones BW3

  1. Centre for Eye Health, University of New South Wales (UNSW), Kensington, NSW, Australia.
  2. School of Optometry and Vision Science, UNSW, Sydney, NSW, Australia.
  3. Moran Eye Center, Univ of Utah, Salt Lake City, UT, United States of America.
  4. Department of Optometry and Vision Science, Univ of Melbourne, Parkville, Victoria, Australia

Purpose: To establish the correlation between visual field sensitivity and ganglion cell density within the central 20 degrees.  We hypothesized that the use of a test stimulus within complete spatial summation (Goldmann II, GII) would display improved correlation compared to the standard GIII test stimulus.

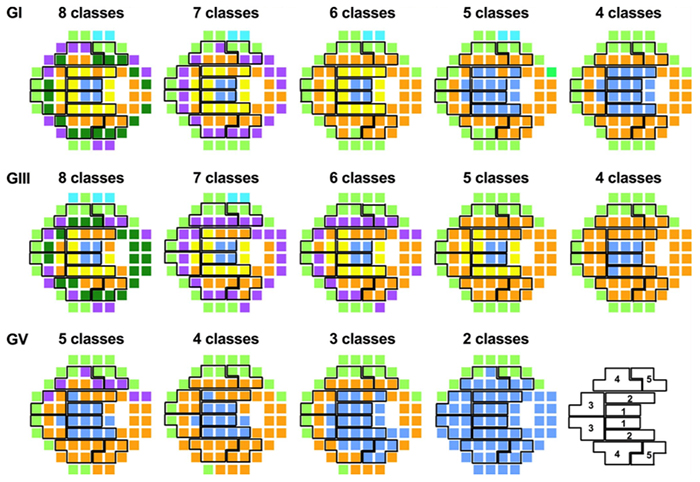
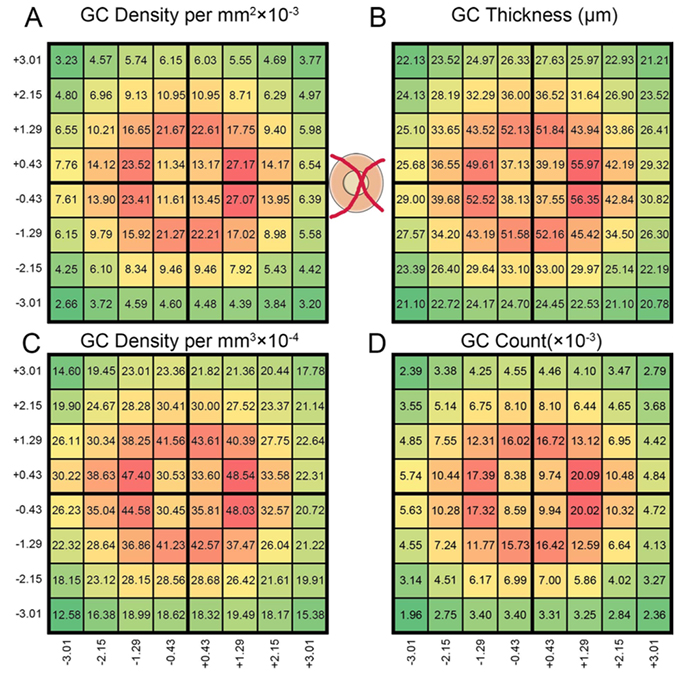
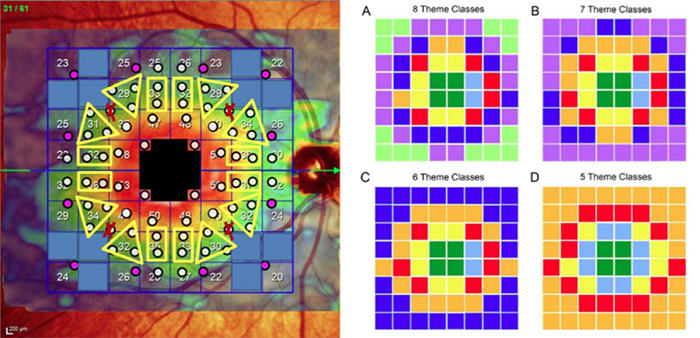
Methods:One eye of 40 normal subjectswas included in this study. The Humphrey Field Analyser (HFA) was used in full-threshold mode for the 10-2 test grid and 12 points from the 30-2 grid that matched the outer Spectralis grid. Spectralis OCT posterior pole scans for each subject was extracted and the average ganglion cell layer (GCL) thickness values were obtained for each of the 64 grid location within the measurement area ~6880µmx6880µm.  HFA sensitivity in dB was plotted against GC density/mm3(calculated from GCL thickness and GC density from histological data, also converted into dB). Both visual field and OCT data were converted to a 50 year-old equivalent for analysis. The Drasdo et al VR 2007 correction was applied to visual field data to allow comparison of structure and function (Fig. 1). Linear regression analysis was conducted at each test location using individual data or grouped data derived using the 5, 6, 7 and 8 GC iso-density theme classes of Yoshioka et al IOVS 2017 (Fig. 1). A non-parametric bootstrap was used to determine the 99% distribution limits of the slope and correlation parameters.

Results: Table 1 shows the structure-function correlation slope parameters and coefficients of determination (R2) for point-wise and theme class-based comparisons, using GII and GIII. The use of 5 or 6 theme classes resulted in a slope close to unity and high R2values for GII. Table 2 shows the 99% distribution of the slope parameters and R2values for point wise comparisons and those using 5 theme classes again demonstrating superior correlations for GII (both slope and R2 significantly different p<0.01 compared to pointwise analysis). Correcting the data for test size difference (6dB) did not result in data superposition confirming that GIII test size is not within complete spatial summation within the central 20 degrees.

Conclusions:Using a test stimulus within complete spatial summation (GII) and grouping sensitivities according to GC density test grids derived using pattern recognition (7 or fewer GC theme classes), revealed correlations close to unity with coefficients of determination (R2) >0.90. The high correlations achieved when using theme classes even when using individual datasets, suggests that an approach would provide a useful method to predict alterations of visual field sensitivity from OCT data.

Commercial Relationships Disclosure:MK and SKK commercial Relationship(s):2014/094035 A1 (USA) and 13865419.9 (EU):Code P (Patent): REM, JT, BZ, L N-S, BJ, RF: none

Grant support:  NHMRC 1033224;Guide Dogs NSW/ACT; NIH EY02576, EY015128, EY014800, an Unrestricted Grant to the Moran Eye Center from Research to Prevent Blindness.

Impact of Glaucoma On Retinal Ganglion Cell Subtypes: A Single-Cell RNA-seq Analysis of the DBA/2J Mouse

This abstract was presented today, May 1st at the 2018 Association for Research in Vision and Opthalmology (ARVO) meetings in Honolulu, Hawaii by Siamak Yousefi, Hao Chen, Jesse Ingels, Sumana R. Chintalapudi, Megan Mulligan, Bryan W. Jones, Vanessa Marie Morales-Tirado, Pete Williams, Simon W. John, Felix Struebing, Eldon E. Geisert, Monica Jablonski, Lu Lu, Robert Williams

Purpose
We are developing methods to define molecular signatures of cellular stress during early stages of glaucoma for major subtypes of retinal ganglion cells (RGCs). Our first aim is to develop reliable mRNA biomarkers for RGC subtypes in the DBA/2J (D2) mouse model prior to disease onset. Our second objective is to quantify cellular stress in RGC subtypes at early stages of disease using known sets of stress-responsive transcripts (e.g. Struebing et al, 2016 PMID:27733864; Williams et al. 2017, PMID:28209901; Lu et al, ARVO 2018).

Methods
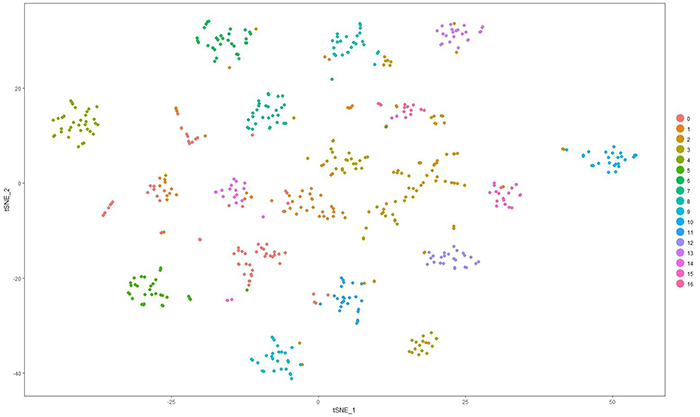
Whole retinas from D2 or D2.Cg-Tg(Thy1-CFP)23Jrs/SjJ at 130 to 150 days-of-age were dissociated gently and size selected (>10 µm). RGCs were enriched using THY1 antibody-coated beads. Fluidigm HT microfluidics plates were used to isolate and generate scRNA-seq libraries of full length polyA-positive mRNAs using SMART-Seq v4. Libraries were sequenced using HiSeq3000, PE151. Following alignment using STAR, expression was normalized to log2(FPKM+1) across ~25,000 unique transcript models. Cells with fewer than 1000 detected genes and genes expressed in fewer than 1% of RGCs were excluded. Sets of genes with high variance and/or high expression were used for principal component analysis (PCA). Twenty PCs were used for graph-based unsupervised clustering and visualized using t-distributed stochastic neighbor embedding (tSNE). Gene specificity was computed for all transcripts across all clusters. The top transcripts per cluster with expression >1 in 1% or more of cells, were used to diagnose cellular identify of clusters. The top 30 genes per cluster were searched in PubMed against a panel of cell and tissue specific terms using Chilibot.

Results
The scRNA-seq protocol generates 150,000 – 200,000 uniquely mapped mRNA reads/cell and ~5000 genes/cells. We currently have 1600 cells, of which over half are RGCs. Around 75% of cells are positive for two or more of the following RGC markers: Thy1, Rbpms, Rbpms2, Jam2, G3bp1, and Ywhaz. This set of cells and different subsets of genes are now being used for RGC clustering. We have identified at least 17 clusters in initial datasets using these protocols and are now linking clusters to major classes of RGCs.

Conclusions
Molecular signatures of cellular stress and RGC subtypes in early stage of glaucoma should now be identifiable using unsupervised learning techniques.

Pattern Recognition Analysis Reveals Unique Contrast Sensitivity Isocontours Using Static Perimetry Thresholds Across The Visual Field

We have a new publication in IOVS, Pattern Recognition Analysis Reveals Unique Contrast Sensitivity Isocontours Using Static Perimetry Thresholds Across The Visual Field (Direct link here).  Authors are:  Jack Phu, Sieu Khuu, Lisa Nivison-Smith, Barbara Zangerl, Agnes Yiu, Jeung Choi, Bryan W. JonesRebecca Pfeiffer, Robert Marc, and Michael Kalloniatis.

Purpose
To determine the locus of test locations that exhibit statistically similar age-related decline in sensitivity to light increments and age-corrected contrast sensitivity isocontours (CSIs) across the central visual field (VF). We compared these CSIs with test point clusters used by the Glaucoma Hemifield Test (GHT).

Methods
Sixty healthy observers underwent testing on the Humphrey Field Analyzer 30-2 test grid using Goldmann (G) stimulus sizes I-V. Age-correction factors for GI-V were determined using linear regression analysis. Pattern recognition analysis was used to cluster test locations across the VF exhibiting equal age-related sensitivity decline (age-related CSIs), and points of equal age-corrected sensitivity (age-corrected CSIs) for GI-V.

Results
There was a small but significant test size–dependent sensitivity decline with age, with smaller stimuli declining more rapidly. Age-related decline in sensitivity was more rapid in the periphery. A greater number of unique age-related CSIs was revealed when using smaller stimuli, particularly in the mid-periphery. Cluster analysis of age-corrected sensitivity thresholds revealed unique CSIs for GI-V, with smaller stimuli having a greater number of unique clusters. Zones examined by the GHT consisted of test locations that did not necessarily belong to the same CSI, particularly in the periphery.

Conclusions
Cluster analysis reveals statistically significant groups of test locations within the 30-2 test grid exhibiting the same age-related decline. CSIs facilitate pooling of sensitivities to reduce the variability of individual test locations. These CSIs could guide future structure-function and alternate hemifield asymmetry analyses by comparing matched areas of similar sensitivity signatures.

Pattern Recognition Analysis of Age-Related Retinal Ganglion Cell Signatures In The Human Eye

We have a new publication in IOVS, Pattern Recognition Analysis of Age-Related Retinal Ganglion Cell Signatures In The Human Eye (Direct link here).  Authors are:  Nayuta Yoshioka, Barbara Zangerl, Lisa Nivison-Smith, Sieu Khuu, Bryan W. Jones, Rebecca Pfeiffer, Robert Marc, and Michael Kalloniatis.

Purpose: We recently used pattern recognition analysis to show macula areas can be classified into statistically distinct clusters in accordance to their age-related retinal ganglion cell layer (RGCL) thickness change in a normal population. The aim of this study was to perform a retrospective cross-sectional analysis utilizing a large cohort of patients to establish accuracy of this model and to develop a normative dataset using a 50-year-old equivalent cohort.

Methods: Data was collected from patients seen at the Centre for Eye Health for optic nerve assessment without posterior pole disease. The grid-wise RGCL thickness was obtained from a single eye of each patient via Spectralis OCT macular scan over an 8×8 measurement grid. Measurements for patients outside the 45-54 age range (training cohort) were converted to 50-year-old equivalent value utilizing pattern recognition derived regression model which, in brief, consists of 8×8 grid clustered into 8 distinct classes according to the pattern of RGCL thickness change with age. Accuracy of the predictions was assessed by comparing the training cohort’s measurements to the 45-54 year reference cohort using t-test and one-way ANOVA.

Results: Data were collected from a total 248 patients aged 20 to 78.1 years. 80 patients within this group were aged 45 – 54 and formed the reference cohort (average±SD 49.6±2.83) and the remaining 168 eyes formed the training cohort (average age±SD 50.7±17.34). Converted values for the training set matched those of the reference cohort (average disparity±SD 0.10±0.42µm, range -0.74-1.34µm) and were not significantly different (p > 0.9). Most variability was observed with patients above 70 years of age (average disparity±SD -0.09±1.73µm, range -3.67 to 6.16µm) and central grids corresponding to the fovea (average disparity±SD 0.47±0.72µm, range -0.22 to 1.34µm).

Conclusions: Our regression model for normal age-related RGCL change can accurately convert and/or predict RGCL thickness for individuals in comparison to 50-year-equivalent reference cohort and could allow for more accurate assessment of RGCL thickness and earlier detection of significant loss in the future. Caution may be needed when applying the model in the foveal area or for patients older than 70 years.

The Rod-Cone Crossover Connectome of Mammalian Bipolar Cells

We have a new publication out (direct link), The rod-cone crossover connectome of mammalian bipolar cells authored by Scott Lauritzen, Crystal Sigulinsky, James Anderson, Michael Kalloniatis, Noah Nelson, Danny Emrich, Chris Rapp, Nicolas McCarthy, Ethan Kerzner, Mariah Meyer, Bryan W. Jones, and Robert Marc.

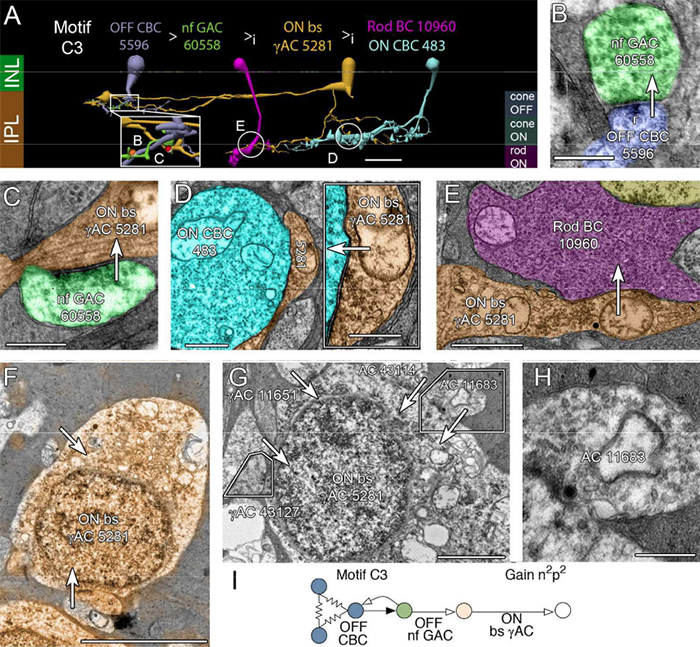
Abstract: The basis of cross-suppression between rod and cone channels has long been an enigma. Using rabbit retinal connectome RC1, we show that all cone bipolar cell (BC) classes inhibit rod BCs via amacrine cell (AC) motifs (C1-6); that all cone BC classes are themselves inhibited by AC motifs (R1-5, R25) driven by rod BCs. A sparse symmetric AC motif (CR) is presynaptic and postsynaptic to both rod and cone BCs. ON cone BCs of all classes drive inhibition of rod BCs via motif C1 wide-field GABAergic ACs (γACs) and motif C2 narrow field glycinergic ON ACs (GACs). Each rod BC receives ≈ 10 crossover AC synapses and each ON cone BC can target ≈ 10 or more rod BCs via separate AC processes. OFF cone BCs mediate monosynaptic inhibition of rod BCs via motif C3 driven by OFF γACs and GACs and disynaptic inhibition via motifs C4 and C5 driven by OFF wide-field γACs and narrow-field GACs, respectively. Motifs C4 and C5 form halos of 60-100 inhibitory synapses on proximal dendrites of AI γACs. Rod BCs inhibit surrounding arrays of cone BCs through AII GAC networks that access ON and OFF cone BC patches via motifs R1, R2, R4 R5 and a unique ON AC motif R3 that collects rod BC inputs and targets ON cone BCs. Crossover synapses for motifs C1, C4, C5 and R3 are 3-4x larger than typical feedback synapses, which may be a signature for synaptic winner-take-all switches.

Ultrastructural Reconstruction of ON Cone Bipolar Cell Projective Fields In The Innter Plexiform Layer of The Rabbit Retina

retina reconstruction

This abstract was presented at the 2014 FASEB Summer Research Conference in Saxtons River, Vermont by J. Scott Lauritzen, Crystal L. Sigulinsky, Noah T. Nelson, Nathan R. Sherbotie, Danny P. Emrich, Rebecca L. Pfeiffer, Jefferson R. Brown, John V. Hoang, Joshua M. Dudleston, Carl B. Watt, Kevin Rapp, Marguerite V. Shaw, Jia-Hui Yang, James R. Anderson, Bryan W. Jones and Robert E. Marc.

Purpose: Functional mapping in tiger salamander shows that bipolar cell (BC) projective fields far exceed their axonal fields, and directly implicates wide-field GABAergic amacrine cells (wf γACs) and gap junctions (Asari & Meister, 2014). Strikingly, single BCs exert differential effects on functionally distinct ganglion cells (GCs), likely achieved by privatized amacrine cell (AC) presynaptic inhibition to specific BC-GC synaptic pairs (Asari & Meister, 2012). To address whether BC projective fields in the mammal are equally broad, wf γAC- and gap junction-dependent, and GC type unselective, we reconstructed all electrical and chemical synaptic partners of a single ON cone BC in the inner plexiform layer of the rabbit retina, and searched BC-GC synaptic pairs for differential synaptic inhibition.

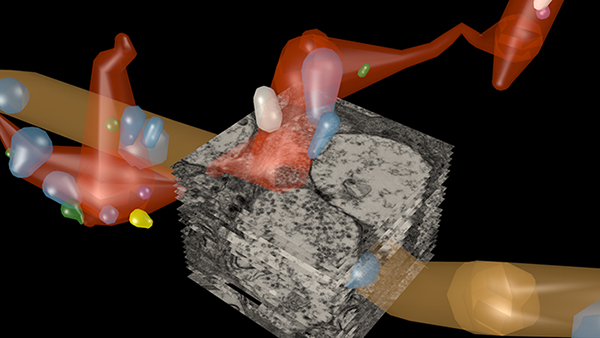
Methods: Cells in retinal connectome 1 (RC1) were annotated with Viking viewer, and explored via connectivity visualizations and 3D rendering (Anderson et al., 2011). Small molecule signals embedded in RC1, e.g. GABA, glycine, and L-glutamate, combined with morphological reconstruction and connectivity analysis allow robust cell classification. We used the MacNeil et al. (2004) rabbit BC classification scheme.

Results: CBb5w 593 is one of 20 ON cone BCs of this class in RC1. This CBb5w is presynaptic to 17 distinct GCs and 262 AC processes, and postsynaptic to 228 AC processes. The majority of these ACs are wf γACs. We estimate this BC forms synapses with 50 unique ACs. Asari & Meister (2014) found that single bipolar cell projective fields range up to 1 mm, far beyond a BC axonal field, and differentially drive multiple classes of GC. We discovered BC-BC within- and cross-class coupling and lateral inhibition that construct sign-conserving and sign-inverting projective fields to many distinct ganglion cell classes across the entire 0.25 mm diameter of RC1, much greater than a 60 µm BC axonal field. Cross-class projections access a broader set of GCs than expected from in-class projections alone. The BC-BC coupling is independent of BC-AII AC coupling. 94% of the CBb5w 593 BC-GC synaptic pairs receive feedback inhibition within the varicosity of the ribbon, but the number of feedback synapses is highly variable (coefficient of variation = 0.81). 35% of the BC-GC pairs receive feedforward inhibition within 2 microns of the postsynaptic density.

Conclusions: Mammalian BCs use novel cross-class topologies to distribute signals to a wide range of GCs and establish projective fields similar to those discovered in non-mammalian species. BC-BC within- and cross-class coupling and lateral inhibition via wf γACs establish sign-conserving and sign-inverting projective fields, respectively, up to 1 mm diameters. BC-GC synaptic pairs overwhelmingly employ feedback vs. feedforward inhibition to modulate signaling, and the numbers of feedback synapses are highly variable across these pairs, accounting for privatized and differential GC responses to the same BC drive.