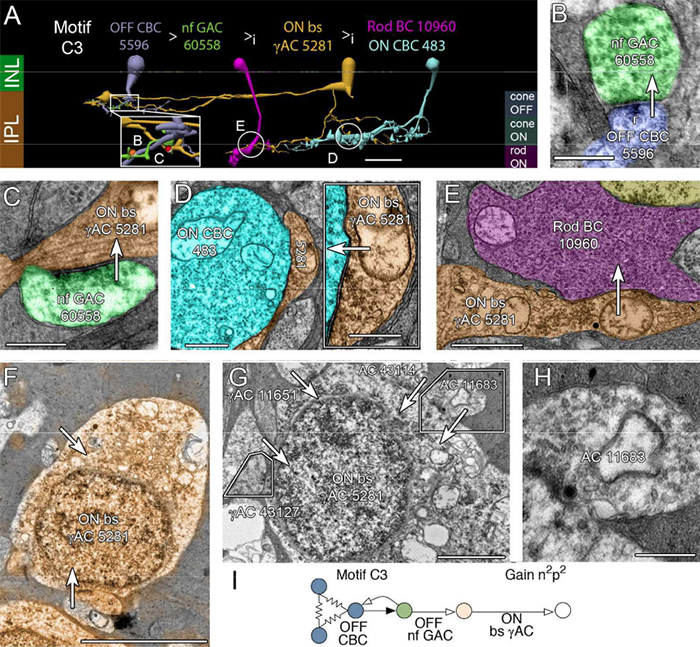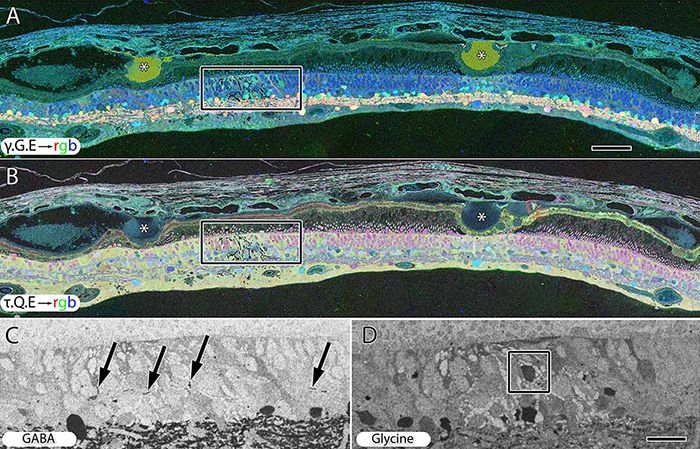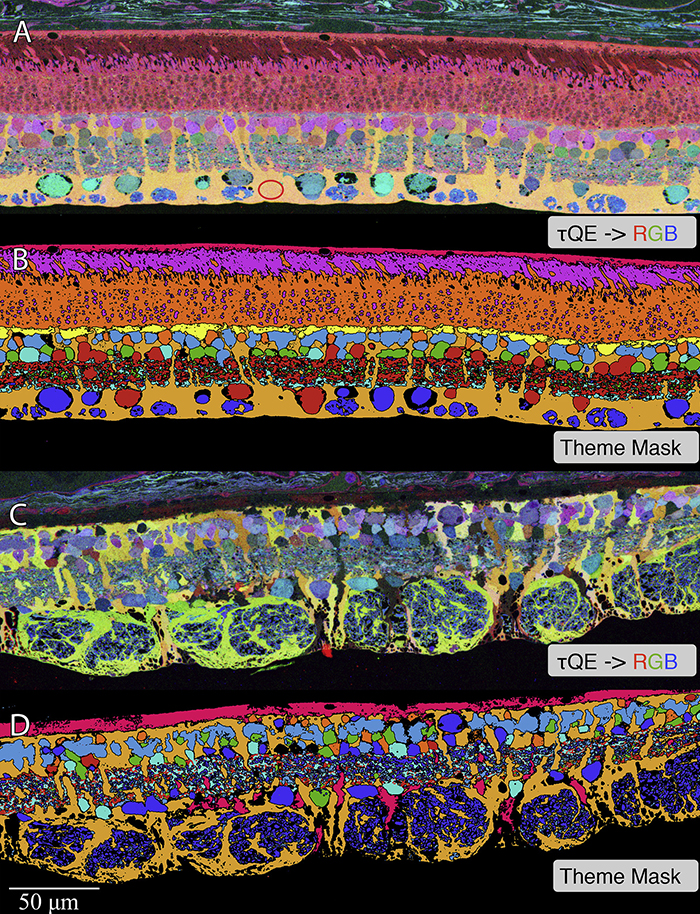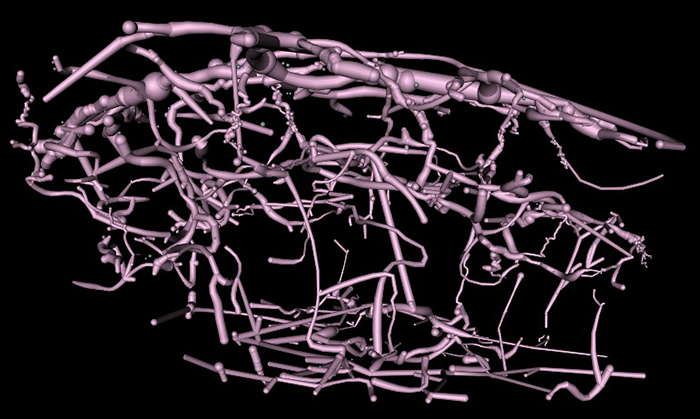
We have a new publication in IOVS, Pattern Recognition Analysis of Age-Related Retinal Ganglion Cell Signatures In The Human Eye (Direct link here). Authors are: Nayuta Yoshioka, Barbara Zangerl, Lisa Nivison-Smith, Sieu Khuu, Bryan W. Jones, Rebecca Pfeiffer, Robert Marc, and Michael Kalloniatis.
Purpose: We recently used pattern recognition analysis to show macula areas can be classified into statistically distinct clusters in accordance to their age-related retinal ganglion cell layer (RGCL) thickness change in a normal population. The aim of this study was to perform a retrospective cross-sectional analysis utilizing a large cohort of patients to establish accuracy of this model and to develop a normative dataset using a 50-year-old equivalent cohort.
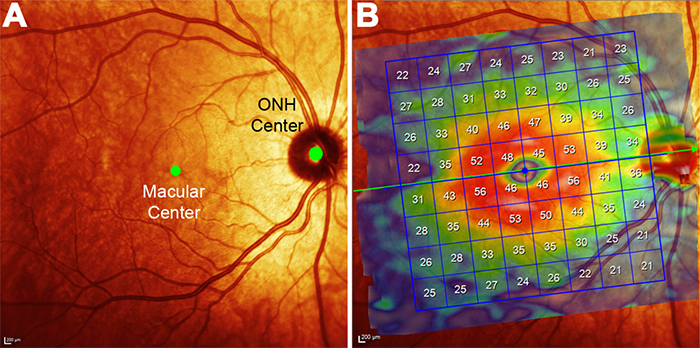
Methods: Data was collected from patients seen at the Centre for Eye Health for optic nerve assessment without posterior pole disease. The grid-wise RGCL thickness was obtained from a single eye of each patient via Spectralis OCT macular scan over an 8×8 measurement grid. Measurements for patients outside the 45-54 age range (training cohort) were converted to 50-year-old equivalent value utilizing pattern recognition derived regression model which, in brief, consists of 8×8 grid clustered into 8 distinct classes according to the pattern of RGCL thickness change with age. Accuracy of the predictions was assessed by comparing the training cohort’s measurements to the 45-54 year reference cohort using t-test and one-way ANOVA.
Results: Data were collected from a total 248 patients aged 20 to 78.1 years. 80 patients within this group were aged 45 – 54 and formed the reference cohort (average±SD 49.6±2.83) and the remaining 168 eyes formed the training cohort (average age±SD 50.7±17.34). Converted values for the training set matched those of the reference cohort (average disparity±SD 0.10±0.42µm, range -0.74-1.34µm) and were not significantly different (p > 0.9). Most variability was observed with patients above 70 years of age (average disparity±SD -0.09±1.73µm, range -3.67 to 6.16µm) and central grids corresponding to the fovea (average disparity±SD 0.47±0.72µm, range -0.22 to 1.34µm).
Conclusions: Our regression model for normal age-related RGCL change can accurately convert and/or predict RGCL thickness for individuals in comparison to 50-year-equivalent reference cohort and could allow for more accurate assessment of RGCL thickness and earlier detection of significant loss in the future. Caution may be needed when applying the model in the foveal area or for patients older than 70 years.