Tag Archives: retina

Model-Based Comparison of Current Flow in Rod Bipolar Cells of Healthy and Early-Stage Degenerated Retina

We have a new manuscript out in Experimental Eye Research, Model-Based Comparison of Current Flow in Rod Bipolar Cells of Healthy and Early-Stage Degenerated Retina. (pdf here)

Authors: Pragya Kosta, Ege Iseri, Kyle Loizos, Javad Paknahad, Rebecca L. Pfeiffer @BeccaPfeiffer19, Crystal L. Sigulinsky @CLSigulinsky, James R. Anderson, Bryan W. Jones @BWJones, and Gianluca Lazzi.

Abstract: Retinal degenerative diseases, such as retinitis pigmentosa, are generally thought to initiate with the loss of photoreceptors, though recent work suggests that plasticity and remodeling occurs prior to photoreceptor cell loss. This degeneration subsequently leads to death of other retinal neurons, creating functional alterations and extensive remodeling of retinal networks. Retinal prosthetic devices stimulate the surviving retinal cells by applying external current using implanted electrodes. Although these devices restore partial vision, the quality of restored vision is limited. Further knowledge about the precise changes in degenerated retina as the disease progresses is essential to understand how current flows in retinas undergoing degenerative disease and to improve the performance of retinal prostheses. We developed computational models that describe current flow from rod photoreceptors to rod bipolar cells


Model-based Comparison of Current Flow in Rod Bipolar Cells of Healthy and Early-Stage Degenerated Retina

Contrast Sensitivity Isocontours Of The Central Visual Field

We have a new manuscript out in Nature Scientific Reports, Contrast Sensitivity Isocontours Of The Central Visual Field.

Authors: Agnes Y. J. Choi, Lisa Nivison-Smith, Jack Phu, Barbara Zangerl, Sieu K. Khuu, Bryan W. Jones, Rebecca L. Pfeiffer, Robert E. Marc & Michael Kalloniatis.

Abstract: Standard automated perimetry (SAP), the most common form of perimetry used in clinical practice, is associated with high test variability, impacting clinical decision making and efficiency. Contrast sensitivity isocontours (CSIs) may reduce test variability in SAP by identifying regions of the visual field with statistically similar patterns of change that can be analysed collectively and allow a point (disease)-to-CSI (normal) comparison in disease assessment as opposed to a point (disease)-to-point (normal) comparison. CSIs in the central visual field however have limited applicability as they have only been described using visual field test patterns with low, 6° spatial sampling. In this study, CSIs were determined within the central 20° visual field using the 10-2 test grid paradigm of the Humphrey Field Analyzer which has a high 2° sampling frequency. The number of CSIs detected in the central 20° visual field was greater than previously reported with low spatial sampling and stimulus size dependent: 6 CSIs for GI, 4 CSIs for GII and GIII, and 3 CSIs for GIV and GV. CSI number and distribution were preserved with age. Use of CSIs to assess visual function in age-related macular degeneration (AMD) found CSI guided analysis detected a significantly greater deviation in sensitivity of AMD eyes from normal compared to a standard clinical pointwise comparison (−1.40 ± 0.15 dB vs −0.96 ± 0.15 dB; p < 0.05). This work suggests detection of CSIs within the central 20° is dependent on sampling strategy and stimulus size and normative distribution limits of CSIs can indicate significant functional deficits in diseases affecting the central visual field such as AMD.

Coupling architecture of the retinal Aii/ON cone bipolar cell network and alteration in degeneration

This poster was presented today, July 28th at the 2019 International Gap Junction Conference in Victoria, Canada by Crystal L. Sigulinsky, Rebecca L. PfeifferJames R. Anderson, Christopher Rapp, Jeebika Dahal, Jessica C Garcia, Jia-Hui Yang, Daniel P. Emrich, Hope Morrison, Kevin D. Rapp, Carl B. Watt, Mineo Kondo, Hiroko Terasaki, Robert E. Marc and Bryan W. Jones.

Almost full resolution version here.

Authors:

Crystal L Sigulinsky1, Rebecca L Pfeiffer1, James R. Anderson1, Christopher N. Rapp1, Jeebika Dahal1, Jessica C Garcia1, Jia-Hui Yang1, Daniel P. Emrich1, Hope Morrison1, Kevin D. Rapp1, Carl B. Watt1, Mineo Kondo2, Hiroko Terasaki3, Robert E. Marc1, Bryan W. Jones1
1Moran Eye Center/ Ophthalmology, University of Utah, Salt Lake City, Utah, United States; 2Mie University, Tsu, Japan; 3Nagoya University, Nagoya-shi, Japan;

ABSTRACT:

Background and aim:
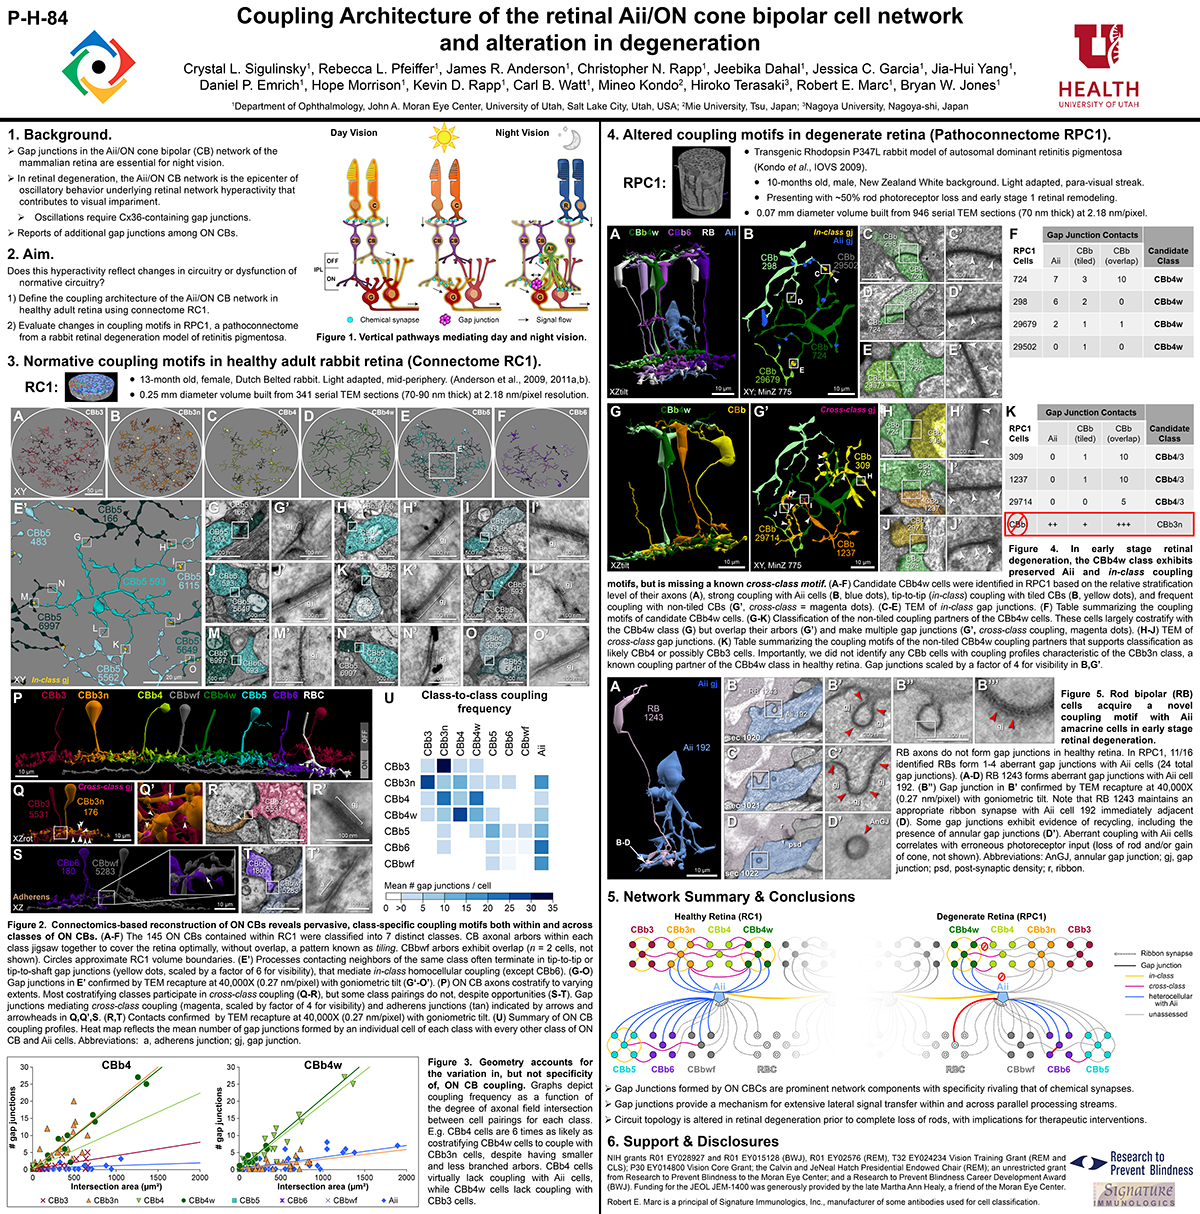
Gap junctions are prevalent throughout the neural retina, with expression by every major neuronal class and at every level of signal processing. Yet, the functional roles and expressing cells/participating networks for many remain unknown. Spontaneous network spontaneous hyperactivity observed during retinal degeneration contributes to visual impairment and requires gap junctional coupling in the Aii amacrine cell/ON cone bipolar cell (CBC) network.  However, it remains unclear whether this hyperactivity reflects changes in the underlying circuitry or dysfunction of the normative circuitry. Here, we used connectomics-based mapping of retinal circuitry to 1) define the coupling architecture of the Aii/ON CBC network in healthy adult rabbit retina using connectome RC1 and 2) evaluate changes in coupling motifs in RPC1, a pathoconnectome from a rabbit retinal degeneration model.

Methods:

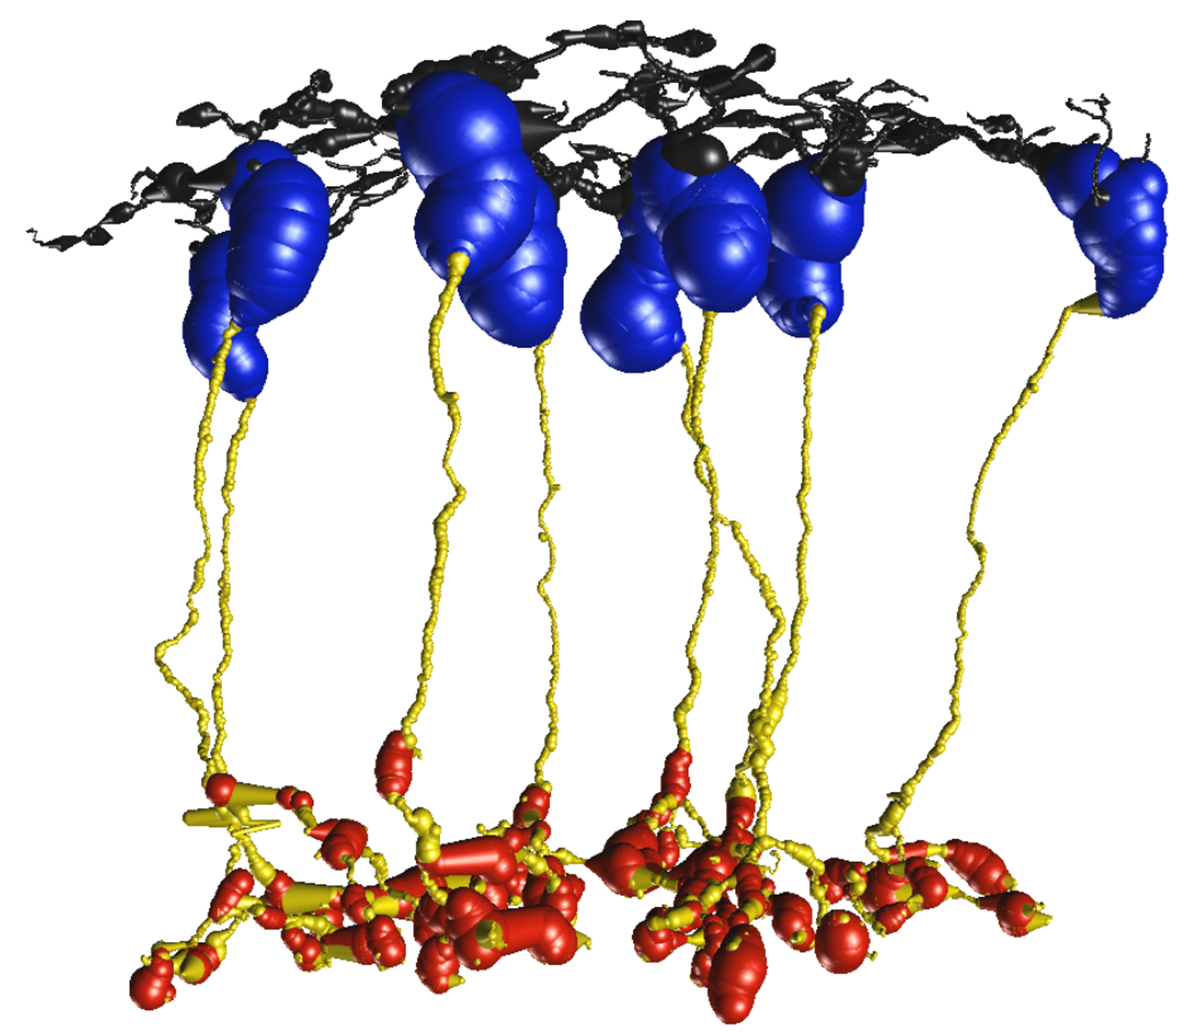
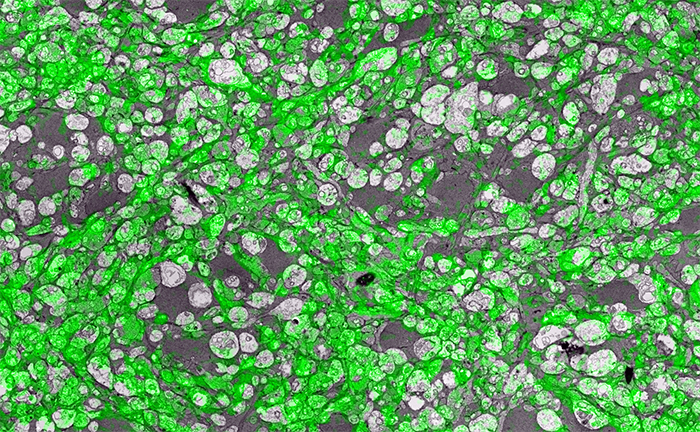
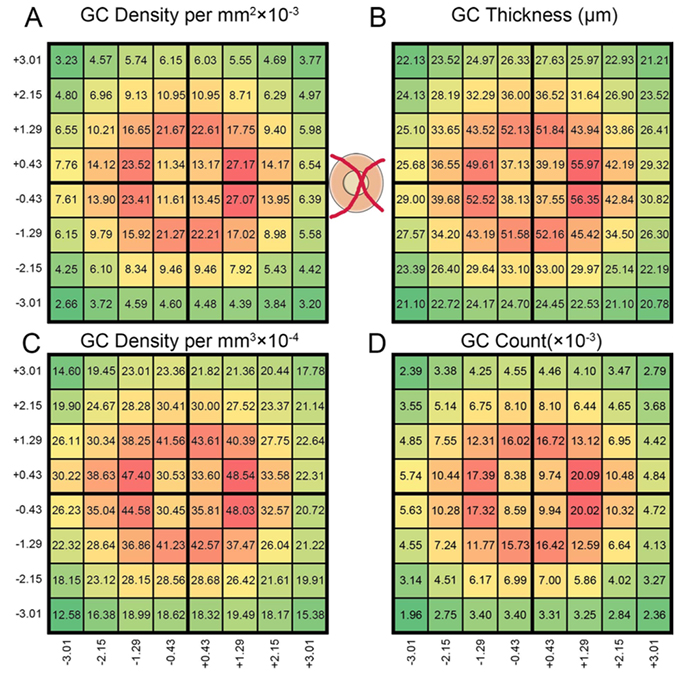
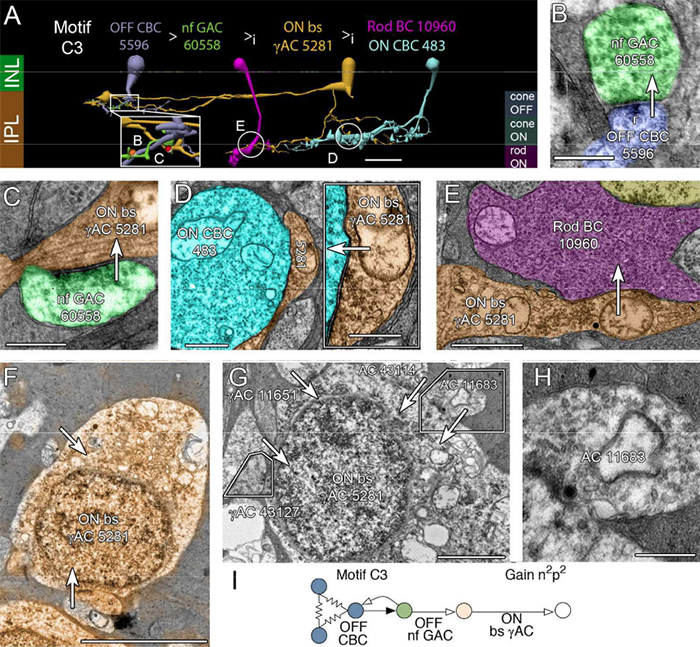
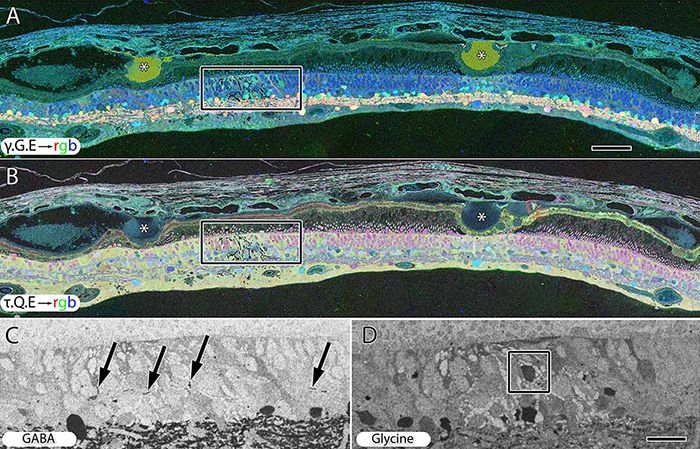
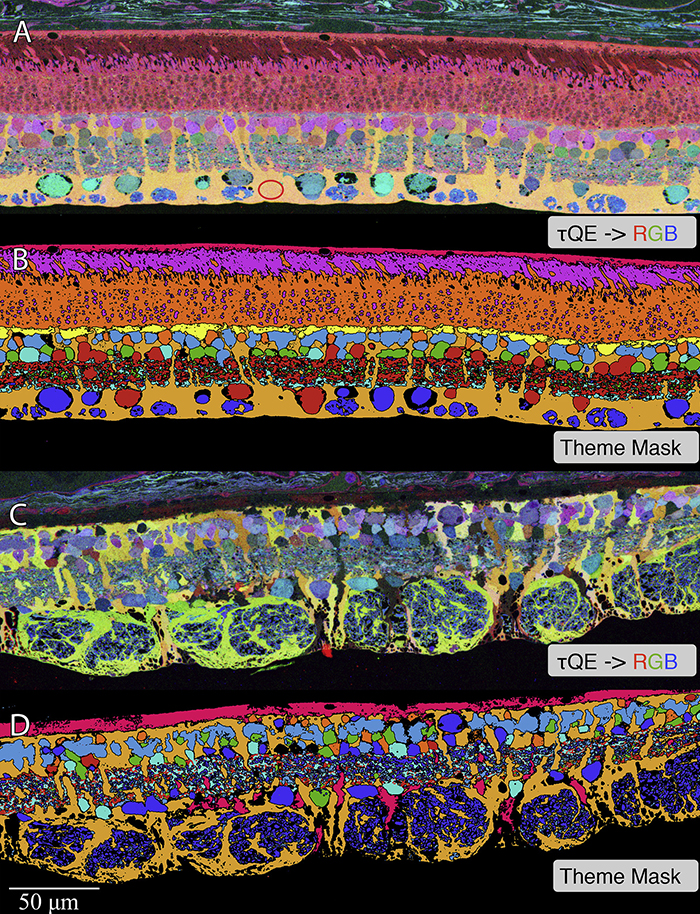
RC1 and RPC1 are connectomes built by automated transmission electron microscopy at ultrastructural (2 nm/pixel) resolution. RC1 is a 0.25 mm diameter volume of retina from a 13-month old, light adapted female Dutch Belted rabbit. RPC1 is a 0.07 mm diameter volume of degenerate retina from a transgenic P347L model of autosomal dominant retinitis pigmentosa (10-months old, male, New Zealand White background) presenting with ~50% rod loss. ON CBCs, Aii amacrine cells, and their coupling partners were annotated using the Viking application. Coupling motifs and features were explored with 3D rendering and network graph visualization. Gap junctions were validated by 0.25 nm resolution recapture with goniometric tilt when necessary.

Results:

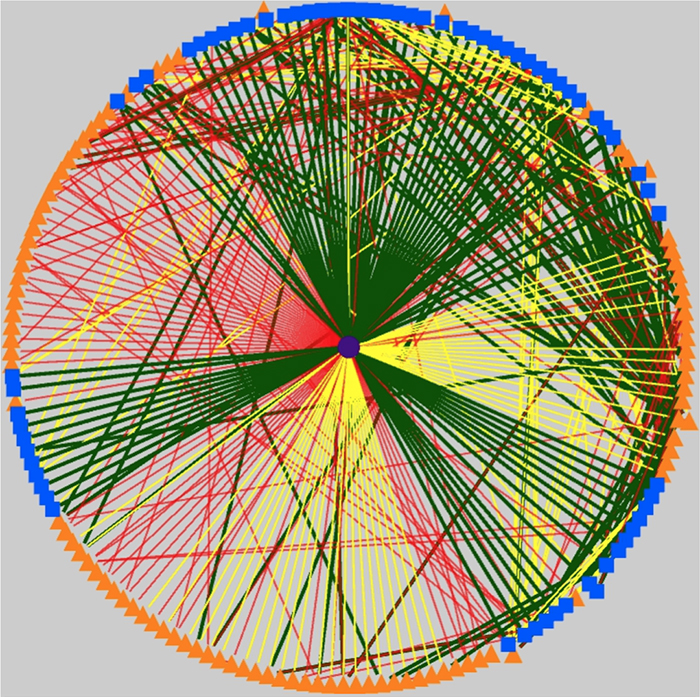
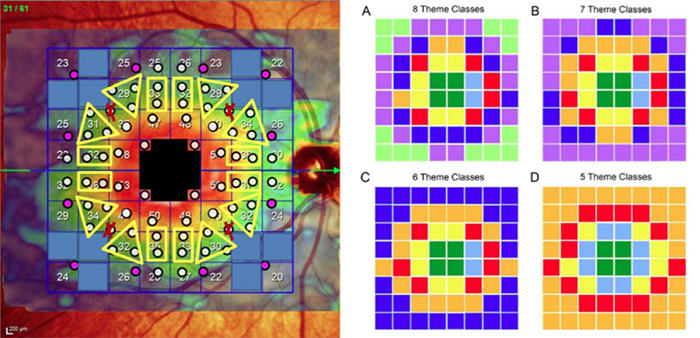
Complete reconstruction of 37 ON CBCs in RC1 yielded 1339 gap junctions and revealed pervasive in- and cross-class coupling motifs among ON CBCs that produce complex network topologies within the coupled Aii network. Robust rulesets underlie class-specific coupling profiles with specificity defined beyond geometric opportunity. These coupling profiles enabled classification of all 145 ON CBCs contained within RC1 into 7 distinct classes. In RPC1, two ON CBC classes appear to retain their class-specific coupling profiles, accepting and rejecting specific combinations of Aii and ON CBC class partnerships. However, aberrant partnerships exist, including both loss of motifs and acquisition of novel ones.

Conclusions:

Gap junctions formed by ON CBCs are prominent network components, with specificity rivaling that of chemical synapses. These gap junctions not only subserve canonical signal transfer for night vision, but also extensive coupling within and across the parallel processing streams. Clearly aberrant morphological and synaptic changes exist in RPC1, including changes in the coupling specificity of both Aii and ON CBCs. Thus, circuit topology is altered prior to complete loss of rods, with substantial implications for therapeutic interventions for blinding diseases that depend upon the surviving retinal network.

Simple Super-Resolution Microscopy

Super-resolution microscopy is a pretty big thing right now.  But there is more than one way to get super-resolution microscopy results.  There are a variety of approaches, most involving expensive new microscopes that preclude many scientists from participating in science that allows them to ask certain questions.  However, if they have access to a standard transmission election microscope and have antibodies that are glutaraldehyde tolerant, they can participate and ask questions that allow them to get around some of the inherent limitations imposed by physics.

In the image above for example, we have GABA labeling in green superimposed upon ultrastructural data showing us *which* processes in the inner plexiform layer of the retina are GABAergic.  Many of these processes are smaller than the wavelength of light.

There are multiple ways to get here of course with some very expensive microscopes offering dual light and electron microscopy approaches and yet other microscopes offering purely optical based solutions.  However, this is cheap and easy and accessible to many with the basic electron microscopy resources. Robert Marc first used this approach in back in 2000, and we subsequently used it for quite a bit of work for my Ph.D. dissertation in 2003, and notably in this paper.  It is also an integral technique associated with our connectomics efforts.

That said, I’ll need at some point soon to find the resources to get a traditional optical super-resolution microscopy solution to answer some questions we have in the lab on neural degenerative disease.

(Via Jonesblog)

Increasing Electrical Stimulation Efficacy in Degenerated Retina: Stimulus Waveform Design in a Multiscale Computational Model

We have a new publication out (direct link), Increasing Electrical Stimulation Efficacy in Degenerated Retina: Stimulus Waveform Design in a Multiscale Computational Model authored by Kyle Loizos, Robert Marc, Mark Humayun, James R. Anderson, Bryan W. Jones and Gianluca Lazzi.

Abstract—A computational model of electrical stimulation of the retina is proposed for investigating current waveforms used in prosthetic devices for restoring partial vision lost to retina degen- erative diseases. The model framework combines a connectome- based neural network model characterized by accurate mor- phological and synaptic properties with an Admittance Method model of bulk tissue and prosthetic electronics. In this model, the retina was computationally “degenerated,” considering cellular death and anatomical changes that occur early in disease, as well as altered neural behavior that develops throughout the neurodegeneration and is likely interfering with current attempts at restoring vision. A resulting analysis of stimulation range and threshold of ON ganglion cells within retina that are either healthy or in beginning stages of degeneration is presented for currently-used stimulation waveforms, and an asymmetric biphasic current stimulation for subduing spontaneous firing to allow increased control over ganglion cell firing patterns in degenerated retina is proposed. Results show that stimulation thresholds of retinal ganglion cells do not notably vary after beginning stages of retina degeneration. In addition, simulation of proposed asymmetric waveforms showed the ability to enhance the control of ganglion cell firing via electrical stimulation.

Structure-Function Correlation Across The Central Visual Field Using Pointwise Comparisons and Ganglion Cell Isocontours Derived From Pattern Recognition

We presented an abstract for 23rd International visual field and imaging symposium in Kanazawa, Japan on May 12th titled, Structure-function correlation across the central visual field using pointwise comparisons and ganglion cell isocontours derived from pattern recognition.  Authors are:

Kalloniatis M1,2, Tong J1,2, Yoshioka N1,2, Khuu SK2, Phu J1,2, Choi A1,2, Zangerl B1, Nivison-Smith L1,2, Bui BV4, Marc RE3, Jones BW3

  1. Centre for Eye Health, University of New South Wales (UNSW), Kensington, NSW, Australia.
  2. School of Optometry and Vision Science, UNSW, Sydney, NSW, Australia.
  3. Moran Eye Center, Univ of Utah, Salt Lake City, UT, United States of America.
  4. Department of Optometry and Vision Science, Univ of Melbourne, Parkville, Victoria, Australia

Purpose: To establish the correlation between visual field sensitivity and ganglion cell density within the central 20 degrees.  We hypothesized that the use of a test stimulus within complete spatial summation (Goldmann II, GII) would display improved correlation compared to the standard GIII test stimulus.

Methods:One eye of 40 normal subjectswas included in this study. The Humphrey Field Analyser (HFA) was used in full-threshold mode for the 10-2 test grid and 12 points from the 30-2 grid that matched the outer Spectralis grid. Spectralis OCT posterior pole scans for each subject was extracted and the average ganglion cell layer (GCL) thickness values were obtained for each of the 64 grid location within the measurement area ~6880µmx6880µm.  HFA sensitivity in dB was plotted against GC density/mm3(calculated from GCL thickness and GC density from histological data, also converted into dB). Both visual field and OCT data were converted to a 50 year-old equivalent for analysis. The Drasdo et al VR 2007 correction was applied to visual field data to allow comparison of structure and function (Fig. 1). Linear regression analysis was conducted at each test location using individual data or grouped data derived using the 5, 6, 7 and 8 GC iso-density theme classes of Yoshioka et al IOVS 2017 (Fig. 1). A non-parametric bootstrap was used to determine the 99% distribution limits of the slope and correlation parameters.

Results: Table 1 shows the structure-function correlation slope parameters and coefficients of determination (R2) for point-wise and theme class-based comparisons, using GII and GIII. The use of 5 or 6 theme classes resulted in a slope close to unity and high R2values for GII. Table 2 shows the 99% distribution of the slope parameters and R2values for point wise comparisons and those using 5 theme classes again demonstrating superior correlations for GII (both slope and R2 significantly different p<0.01 compared to pointwise analysis). Correcting the data for test size difference (6dB) did not result in data superposition confirming that GIII test size is not within complete spatial summation within the central 20 degrees.

Conclusions:Using a test stimulus within complete spatial summation (GII) and grouping sensitivities according to GC density test grids derived using pattern recognition (7 or fewer GC theme classes), revealed correlations close to unity with coefficients of determination (R2) >0.90. The high correlations achieved when using theme classes even when using individual datasets, suggests that an approach would provide a useful method to predict alterations of visual field sensitivity from OCT data.

Commercial Relationships Disclosure:MK and SKK commercial Relationship(s):2014/094035 A1 (USA) and 13865419.9 (EU):Code P (Patent): REM, JT, BZ, L N-S, BJ, RF: none

Grant support:  NHMRC 1033224;Guide Dogs NSW/ACT; NIH EY02576, EY015128, EY014800, an Unrestricted Grant to the Moran Eye Center from Research to Prevent Blindness.

Pattern Recognition Analysis of Age-Related Retinal Ganglion Cell Signatures In The Human Eye

We have a new publication in IOVS, Pattern Recognition Analysis of Age-Related Retinal Ganglion Cell Signatures In The Human Eye (Direct link here).  Authors are:  Nayuta Yoshioka, Barbara Zangerl, Lisa Nivison-Smith, Sieu Khuu, Bryan W. Jones, Rebecca Pfeiffer, Robert Marc, and Michael Kalloniatis.

Purpose: We recently used pattern recognition analysis to show macula areas can be classified into statistically distinct clusters in accordance to their age-related retinal ganglion cell layer (RGCL) thickness change in a normal population. The aim of this study was to perform a retrospective cross-sectional analysis utilizing a large cohort of patients to establish accuracy of this model and to develop a normative dataset using a 50-year-old equivalent cohort.

Methods: Data was collected from patients seen at the Centre for Eye Health for optic nerve assessment without posterior pole disease. The grid-wise RGCL thickness was obtained from a single eye of each patient via Spectralis OCT macular scan over an 8×8 measurement grid. Measurements for patients outside the 45-54 age range (training cohort) were converted to 50-year-old equivalent value utilizing pattern recognition derived regression model which, in brief, consists of 8×8 grid clustered into 8 distinct classes according to the pattern of RGCL thickness change with age. Accuracy of the predictions was assessed by comparing the training cohort’s measurements to the 45-54 year reference cohort using t-test and one-way ANOVA.

Results: Data were collected from a total 248 patients aged 20 to 78.1 years. 80 patients within this group were aged 45 – 54 and formed the reference cohort (average±SD 49.6±2.83) and the remaining 168 eyes formed the training cohort (average age±SD 50.7±17.34). Converted values for the training set matched those of the reference cohort (average disparity±SD 0.10±0.42µm, range -0.74-1.34µm) and were not significantly different (p > 0.9). Most variability was observed with patients above 70 years of age (average disparity±SD -0.09±1.73µm, range -3.67 to 6.16µm) and central grids corresponding to the fovea (average disparity±SD 0.47±0.72µm, range -0.22 to 1.34µm).

Conclusions: Our regression model for normal age-related RGCL change can accurately convert and/or predict RGCL thickness for individuals in comparison to 50-year-equivalent reference cohort and could allow for more accurate assessment of RGCL thickness and earlier detection of significant loss in the future. Caution may be needed when applying the model in the foveal area or for patients older than 70 years.

The Rod-Cone Crossover Connectome of Mammalian Bipolar Cells

We have a new publication out (direct link), The rod-cone crossover connectome of mammalian bipolar cells authored by Scott Lauritzen, Crystal Sigulinsky, James Anderson, Michael Kalloniatis, Noah Nelson, Danny Emrich, Chris Rapp, Nicolas McCarthy, Ethan Kerzner, Mariah Meyer, Bryan W. Jones, and Robert Marc.

Abstract: The basis of cross-suppression between rod and cone channels has long been an enigma. Using rabbit retinal connectome RC1, we show that all cone bipolar cell (BC) classes inhibit rod BCs via amacrine cell (AC) motifs (C1-6); that all cone BC classes are themselves inhibited by AC motifs (R1-5, R25) driven by rod BCs. A sparse symmetric AC motif (CR) is presynaptic and postsynaptic to both rod and cone BCs. ON cone BCs of all classes drive inhibition of rod BCs via motif C1 wide-field GABAergic ACs (γACs) and motif C2 narrow field glycinergic ON ACs (GACs). Each rod BC receives ≈ 10 crossover AC synapses and each ON cone BC can target ≈ 10 or more rod BCs via separate AC processes. OFF cone BCs mediate monosynaptic inhibition of rod BCs via motif C3 driven by OFF γACs and GACs and disynaptic inhibition via motifs C4 and C5 driven by OFF wide-field γACs and narrow-field GACs, respectively. Motifs C4 and C5 form halos of 60-100 inhibitory synapses on proximal dendrites of AI γACs. Rod BCs inhibit surrounding arrays of cone BCs through AII GAC networks that access ON and OFF cone BC patches via motifs R1, R2, R4 R5 and a unique ON AC motif R3 that collects rod BC inputs and targets ON cone BCs. Crossover synapses for motifs C1, C4, C5 and R3 are 3-4x larger than typical feedback synapses, which may be a signature for synaptic winner-take-all switches.

Retinal Remodeling And Metabolic Alterations in Human AMD

We have a new publication out (direct link, open access), Müller Cell Metabolic Chaos During Retinal Degeneration authored by Bryan W. JonesRebecca Pfeiffer, William Ferrell, Carl Watt, James Tucker, and Robert Marc.

Abstract:

Age-related macular degeneration (AMD) is a progressive retinal degeneration resulting in central visual field loss, ultimately causing debilitating blindness. AMD affects 18% of Americans from 65 to 74, 30% older than 74 years of age and is the leading cause of severe vision loss and blindness in Western populations. While many genetic and environmental risk factors are known for AMD, we currently know less about the mechanisms mediating disease progression. The pathways and mechanisms through which genetic and non-genetic risk factors modulate development of AMD pathogenesis remain largely unexplored. Moreover, current treatment for AMD is palliative and limited to wet/exudative forms. Retina is a complex, heterocellular tissue and most retinal cell classes are impacted or altered in AMD. Defining disease and stage-specific cytoarchitectural and metabolic responses in AMD is critical for highlighting targets for intervention. The goal of this article is to illustrate cell types impacted in AMD and demonstrate the implications of those changes, likely beginning in the retinal pigment epithelium (RPE), for remodeling of the the neural retina. Tracking heterocellular responses in disease progression is best achieved with computational molecular phenotyping (CMP), a tool that enables acquisition of a small molecule fingerprint for every cell in the retina. CMP uncovered critical cellular and molecular pathologies (remodeling and reprogramming) in progressive retinal degenerations such as retinitis pigmentosa (RP). We now applied these approaches to normal human and AMD tissues mapping progression of cellular and molecular changes in AMD retinas, including late-stage forms of the disease.

Müller Cell Metabolic Chaos During Retinal Degeneration

We have a new publication out (direct link, open access), Müller Cell Metabolic Chaos During Retinal Degeneration authored by Rebecca PfeifferRobert Marc, Mineo Kondo, Hiroko Terasaki and Bryan W. Jones.

Abstract:

Müller cells play a critical role in retinal metabolism and are among the first cells to demonstrate metabolic changes in retinal stress or disease. The timing, extent, regulation, and impacts of these changes are not yet known. We evaluated metabolic phenotypes of Müller cells in the degenerating retina.

Retinas harvested from wild-type (WT) and rhodopsin Tg P347L rabbits were fixed in mixed aldehydes and resin embedded for computational molecular phenotyping (CMP). CMP facilitates small molecule fingerprinting of every cell in the retina, allowing evaluation of metabolite levels in single cells.

CMP revealed signature variations in metabolite levels across Müller cells from TgP347L retina. In brief, neighboring Müller cells demonstrated variability in taurine, glutamate, glutamine, glutathione, glutamine synthetase (GS), and CRALBP. This variability showed no correlation across metabolites, implying the changes are functionally chaotic rather than simply heterogeneous. The inability of any clustering algorithm to classify Müller cell as a single class in the TgP347L retina is a formal proof of metabolic variability in the present in degenerating retina.

Although retinal degeneration is certainly the trigger, Müller cell metabolic alterations are not a coherent response to the microenvironment. And while GS is believed to be the primary enzyme responsible for the conversion of glutamate to glutamine in the retina, alternative pathways appear to be unmasked in degenerating retina. Somehow, long term remodeling involves loss of Müller cell coordination and identity, which has negative implications for therapeutic interventions that target neurons alone.